Co-registration
The co-registration of MRI volumes from different phases of the T1-VIBE sequence was conducted on dataset A to ensure precise alignment for further analysis. This process was assessed through visual inspection and various quantitative metrics: Mutual Information (MI), Normalized Cross Correlation (NCC), Mean Absolute Error (MAE), and Structural Similarity Index (SSIM), with detailed explanations provided in the previous subsection. The results are summarized in Table 1.
Using the late arterial and portal venous phases as reference images showed superior performance across all metrics. The late arterial phase recorded the highest MI (1.03) and NCC (0.95), the lowest MAE (804), and a high SSIM (0.87). The portal venous phase also performed well, achieving an MI of 1.02, NCC of 0.95, MAE of 822, and SSIM of 0.87, indicating that the late arterial phase is optimal for co-registration. In contrast, co-registration with the native phase yielded lower results: MI of 0.90, NCC of 0.91, MAE of 1370, and SSIM of 0.83, suggesting it has less shared information and greater intensity differences due to varying contrast. Visual inspections corroborated these findings, confirming that the late arterial phase provided the best alignment. Consequently, the dataset where all phases were co-registered to the late arterial phase was selected for subsequent analyses.
Segmentation
In this section, we present the segmentation performance of three deep learning architectures on data goups A and B, comprising seven labels. The models evaluated are the conventional nnU-Net, the ResEnc nnU-Net, and the Swin UNETR. The assessment was conducted with ensembled predictions to enhance robustness. The averaged results for the four test-sets (Figure A1) are displayed in Table 2.

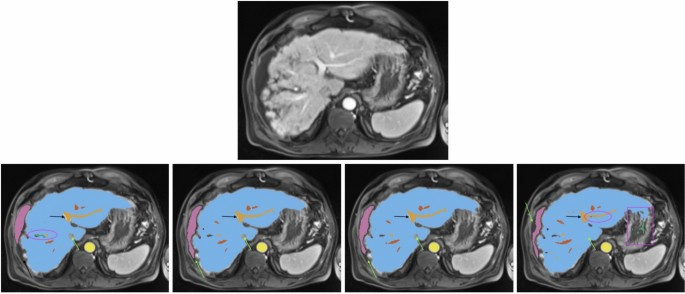
All images show the same axial section of a patient with liver cirrhosis and ascites for the late arterial phase. First row is the given image with no annotations. Labels in the other sections are blue (liver), orange (portal vein), red (hepatic vein), mauve (ascites), green (lesion), and yellow (abdominal aorta). The bottom row from left to right depicts the ground-truth annotations, standard nnU-Net’s, ResEnc nnU-Net’s and SWIN UNETR’s segmentations. Arrows, ellipses and rectangular boxes highlight major differences between the segmentations from the models and the ground-truth annotations.
Liver Parenchyma Segmentation Both nnU-Net variants demonstrated the best performance for liver parenchyma segmentation in this comparison, achieving high scores in DSC, IOU, and TPR. The conventional nnU-Net slightly outperformed its ResEnc counterpart in PPV and VD, indicating marginally superior precision and volume accuracy. While Swin UNETR produced competitive results, it lagged behind both nnU-Net variants across all metrics.
Vessel Segmentation For portal vein and hepatic vein segmentation, the conventional nnU-Net achieved the best performance across most metrics. The ResEnc nnU-Net showed comparable results but fell slightly behind in TPR for hepatic veins. Swin UNETR’s performance was notably lower, particularly in DSC, IOU, and TPR.
Lesions and Ascites Lesion segmentation proved challenging for all models, with the conventional nnU-Net achieving the highest DSC and IOU scores, as well as the lowest LFPR. The ResEnc variant followed closely, while Swin UNETR had the lowest scores across most metrics.
Similar observations were made for ascites segmentation. The conventional nnU-Net outperformed other models in DSC and IOU, closely followed by the ResEnc nnU-Net. Swin UNETR showed significantly lower performance. However, it’s worth noting that the values for this label should be interpreted cautiously. Visual inspection of the nnU-Net’s segmentations for this label revealed a notably high level of precision (see Fig. 2), which may not be fully captured by the numerical values alone. This discrepancy between quantitative measures and qualitative assessment underscores the complexity of evaluating segmentation performance.
Aorta Segmentation Both nnU-Net variants performed similarly well on abdominal and thoracic aorta segmentation, with the conventional nnU-Net slightly ahead in TPR. Swin UNETR, while competitive, was slightly behind in most metrics.
Visual Analysis A visual analysis of segmentation results for a patient with liver cirrhosis and ascites revealed that both nnU-Net variants correctly identified the vena cava inferior as non-liver tissue, whereas Swin UNETR misclassified it as liver (see Fig. 2). In ascites segmentation, the conventional nnU-Net provided the most comprehensive segmentation, followed by the ResEnc nnU-Net. Swin UNETR captured some areas missed by the other models but missed larger portions overall.
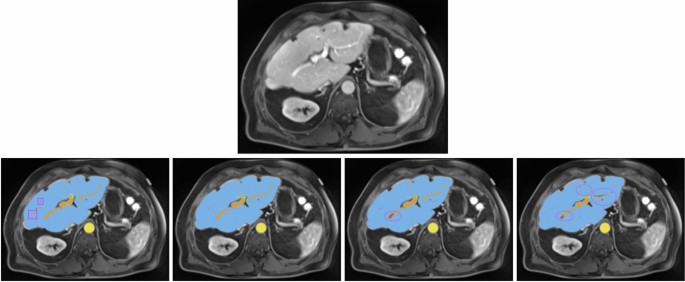
For another patient with impaired liver function (see Fig. 3), the nnU-Net models demonstrated more precise liver parenchyma border segmentation compared to Swin UNETR. All models struggled with correct and precise segmentation of hepatic and portal veins in certain areas, where the ResEnc nnU-Net and the Swin UNETR even misclassified some portions of the portal vein as hepatic vein.

All images show the same axial section of a patient with liver disease for the portalvenous phase. First row is the given image with no annotations. Labels in the other images are blue (liver), orange (portal vein), red (hepatic vein) and yellow (abdominal aorta). The bottom row from left to right depicts the ground-truth annotations, standard nnU-Net’s, ResEnc nnU-Net’s and SWIN UNETR’s segmentations. Arrows and ellipses highlight major differences between the segmentations from the models and the ground-truth annotations. The pink rectangular boxes show hepatic and portal veins in the ground-truth annotations that all of the architectures missed.
Training duration The training of the 20 networks per architecture took about 11, 32.5 and 10 days, for the standard nnU-Net, Residual Encoder nnU-Net and the Swin UNETR, respectively.
Liver function-based segmentation analysis
In this subsection, the results presented in Table 2 are analyzed with respect to their different LiMAx scores. Specifically, the official LiMAx thresholds defined by Stockmann et al.42 were applied to categorize liver function into three groups: significant hepatic injury (LiMAx < 140; n = 13), limited hepatic impairment (140 \(\le\) LiMAx < 314; n = 29), and normal liver function (LiMAx \(\ge\) 315; n = 17). The comparison of segmentation performance, based on Dice scores, is summarized in Table 3. Additional details and a more comprehensive evaluation are provided in Supplementary Tables A1, A2, and A3.
Normal liver function All three architectures achieved high segmentation accuracy for liver parenchyma, abdominal aorta, and thoracic aorta, with DSC values consistently above 0.91. The standard nnU-Net slightly outperformed the other models in most cases, achieving a DSC of 0.98 for liver parenchyma and 0.96 for abdominal aorta. Portal vein segmentation also showed robust performance across models, with the standard nnU-Net achieving the highest DSC of 0.87. However, segmentation of lesions presented challenges, with lower DSC values ranging from 0.44 (ResEnc nnU-Net) to 0.56 (standard nnU-Net).
Limited hepatic impairment Segmentation accuracy remained high for larger anatomical structures such as liver parenchyma (DSC\(\approx\)0.97 across models) and abdominal aorta (DSC=0.96). However, performance decreased slightly for smaller structures like portal vein and hepatic veins, particularly for the Swin UNETR model (DSC=0.76 and 0.69, respectively). Lesion segmentation showed moderate accuracy across models, with the standard nnU-Net achieving the highest DSC of 0.56. Ascites detection was notably inconsistent, with DSC values ranging from 0.17 (Swin UNETR) to 0.35 (standard nnU-Net), reflecting the difficulty of segmenting this structure in T1-weighted images.
Significant hepatic impairment Segmentation performance declined further for smaller or more complex structures such as the portal vein and hepatic veins. The standard nnU-Net demonstrated relatively better robustness, achieving DSC values of 0.73 and 0.72, respectively, compared to Swin UNETR (0.63 and 0.46). Liver parenchyma segmentation remained strong across all models, with DSCs exceeding 0.95, highlighting the reliability of these architectures for larger structures even under severe impairment conditions. Lesion segmentation exhibited variability, with Swin UNETR achieving the lowest DSC (0.42) compared to 0.57 for the standard nnU-Net. Ascites detection showed improved performance in cases of significant hepatic injury, with DSC values exceeding 0.54. This improvement can be attributed to the fact that ascites is typically more pronounced in patients with worse liver function and tends to form a larger anatomical structure in such cases.
The standard nnU-Net consistently outperformed ResEnc nnU-Net and Swin UNETR across most anatomical structures and liver function categories. While ResEnc nnU-Net achieved comparable results in many cases, it struggled slightly with lesion segmentation and smaller structures such as hepatic veins. Swin UNETR demonstrated lower accuracy overall, particularly for complex or small anatomical regions like the portal vein and lesions. Supplementary Tables A1, A2, and A3 provide additional insights into the strengths and weaknesses of each architecture across different liver function categories.
The findings emphasize that all three architectures perform well for major anatomical structures under normal liver function conditions. However, their performance diminishes in varying degrees under impaired liver function scenarios – especially for finer structures like the portal vein or hepatic veins, which become harder to delineate due to reduced visibility in imaging data. Among the evaluated models, the standard nnU-Net remains the most reliable choice overall, consistently achieving higher Dice scores across all categories and anatomical structures.
Cross-scanner validation
The cross-scanner validation performed on dataset C (n=47) demonstrated the generalizability of our models across different MRI scanner architectures while revealing scanner-dependent performance variations. This dataset, acquired on 1.5T Siemens Magnetom Sola and Avanto Fit scanners, presented distinct challenges compared to the primary Skyra 3T data, including differences in signal-to-noise ratio, contrast dynamics, and artifact profiles. The conventional nnU-Net showed remarkable resilience to these variations, maintaining superior performance across most segmentation tasks in this comparison. The results are summarized in Table 4.
For liver parenchyma segmentation, all architectures maintained high Dice scores (nnU-Net: 0.97 [0.94, 0.99], ResEnc: 0.97 [0.95, 0.99], Swin UNETR: 0.92 [0.87, 0.97]), though a slight performance degradation became apparent in the transformer-based model.
The conventional nnU-Net demonstrated strong performance in vascular structure segmentation, achieving DSC values of 0.85 [0.81, 0.89] for portal vein and 0.83 [0.78, 0.88] for hepatic veins. The ResEnc nnU-Net exhibited reduced vascular precision (portal vein DSC: 0.76 [0.70, 0.81] vs. 0.83 [0.79, 0.86] internal), while Swin UNETR showed significant performance drops (hepatic vein DSC: 0.51 [0.44, 0.58] vs. 0.65 [0.61, 0.70] internal), indicating transformer architectures’ sensitivity to scanner-specific features.
Lesion segmentation performance varied notably across the three models. The conventional nnU-Net achieved the highest DSC (0.55 [0.43, 0.67]) and demonstrated strong precision (PPV: 0.93 [0.88, 0.98]). The lesion-wise true positive rate (LTPR) of 0.94 [0.87, 1.01] suggests that nearly all lesions were detected despite scanner differences, although the volume difference (VD) was higher than in the internal dataset. In contrast, the Swin UNETR showed lower performance (DSC: 0.25 [0.14, 0.36]) accompanied by a higher lesion-wise false positive rate (LFPR: 0.76 [0.67, 0.85]), indicating an increased rate of spurious detections.
Ascites segmentation proved challenging for all models when applied to the external validation dataset, with negligible DSC values. This may be attributed to the different contrast and intensity characteristics of ascitic fluid in 1.5T versus 3T scanners, as well as potential differences in sequence parameters that affect fluid visibility and shows where model generalization limits lie.
The aortic segmentation remained robust across scanner types, with the conventional nnU-Net achieving the best performance for both abdominal (DSC: 0.98 [0.98, 0.99]) and thoracic aorta (DSC: 0.97 [0.96, 0.99]), outperforming both ResEnc nnU-Net and Swin UNETR.
These findings highlight the importance of model selection when deploying across heterogeneous scanner environments in clinical settings. The conventional nnU-Net architecture demonstrated superior generalizability in this comparison, maintaining consistent performance levels comparable to those observed in the internal validation, for most structures.