Deciphering lung disease progression through scRNA profiling
To investigate the microenvironmental landscape across the spectrum of human lung disease stages, we performed a comprehensive scRNA-seq analysis on a diverse set of 93 samples including healthy lung tissue from 28 individuals, COPD from 18, IPF from 32, and LUAD from 15 subjects (Fig. 1a). After rigorous quality control and the meticulous exclusion of doublets, 368,904 cells remained for detailed scrutiny. To mitigate and correct for potential batch effects among the samples (Fig. S1a), we employed harmony analysis, a sophisticated computational method. This was followed by a series of analytical techniques including principal component analysis (PCA) and uniform manifold approximation and projection (UMAP) to reduce dimensions and cluster the data. Our unsupervised clustering strategy successfully identified 24 distinct cell clusters (Fig. S1b), with no significant batch effects discernible across the diverse samples (Fig. S1a).
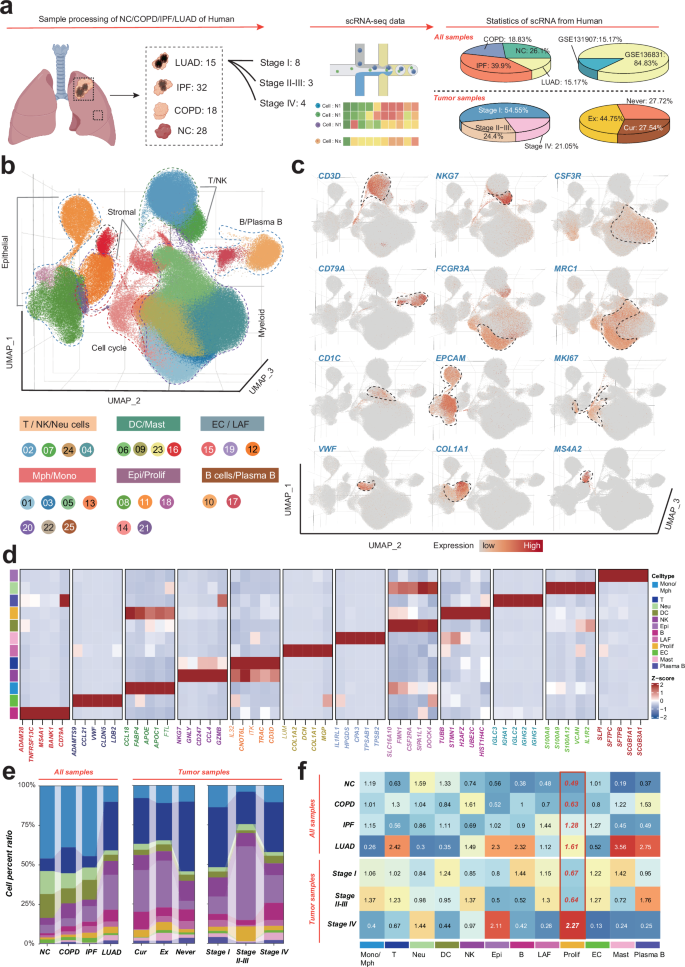
a Schematic of the data generation, study design and the statistics of single-cell data from different datasets. b Uniform manifold approximation and projection (UMAP) analysis of all cells, colored by cell types. c UMAP plots showing expression of canonical marker genes of major cell populations. d The expression levels of representative signature genes. e Stacked barplot showing proportions of major cell populations across groups. Colors represent major cell populations. f Heatmap showing tissue preferences of major cell population in each groups revealed by Ro/e.
Further analysis annotating these clusters into various cell types, including T cells, natural killer (NK) cells, neutrophils, macrophages, monocytes, dendritic cells (DCs), mast cells, epithelial cells, proliferating cells, endothelial cells, lung-associated fibroblasts (LAFs), B and plasma B cells. This classification was based on the characteristic expression profiles of canonical marker genes (Fig. 1c–e, Fig. S1b, c, and Table S3). Our findings were corroborated by cell ratio and Ro/e algorithm analyses, which highlighted a notable enrichment pattern of proliferating cells specifically within the IPF and LUAD groups (Fig. 1f, g and Fig. S1d). This observation provides critical insights into the cellular dynamics of proliferating cells during lung disease progression.
Delineating proliferating cell heterogeneity and molecular signatures in human lung disease progression
We meticulously sorted 9353 proliferating cells from our scRNA-seq analysis and divided them into six distinct subpopulations (Fig. 2a and Table S4). The proliferating subpopulations were characterized by their unique surface markers and subset-specific markers, as delineated in Fig. 2b and Table S4. To gain deeper insights into the functional attributes of these subpopulations, we identified the top five biological processes significantly enriched among the marker genes for each cell cluster, effectively generating a molecular fingerprint for each cluster (Fig. 2c). To delineate the developmental trajectories of proliferating cells, we employed the SCTOUR algorithm. These analyses unveiled a complex, intersecting pattern of differentiation pathways among the proliferating cell subsets, with cluster C3_KRT8 emerging as a central node (Fig. 2d, e). Given that proliferating cells represent a heterogeneous cell subset characterized by specific proliferative features, the inferred pseudotemporal differentiation trajectories should not be interpreted as definitive biological differentiation pathways. Rather, they highlight potential synergistic interactions among spatially proximate proliferating cell subsets, inferred from their UMAP-based trajectory directions. For example, the close spatial proximity and directional trajectory from C2_MMP9 to C1_FABP4 on the UMAP plot suggest a potential functional interplay between these two subpopulations in lung cancer progression. To test this hypothesis, we conducted intercellular communication analysis using the CellChat tool. As shown in Fig. 2f, C3_KRT8 serves as a major sender, with C2_MMP9 and C1_FABP4 being the primary receivers of cellular signaling. The MIF-CD74 + CD44 signaling pathway was identified as a key mediator of communication among these subpopulations (Fig. 2g, h). Notably, spatial transcriptomics analysis revealed spatial colocalization among C1_FABP4, C2_MMP9, and C3_KRT8 at the spatial resolution, further supporting the notion of their potential synergistic role in LUAD progression (Fig. 2i).
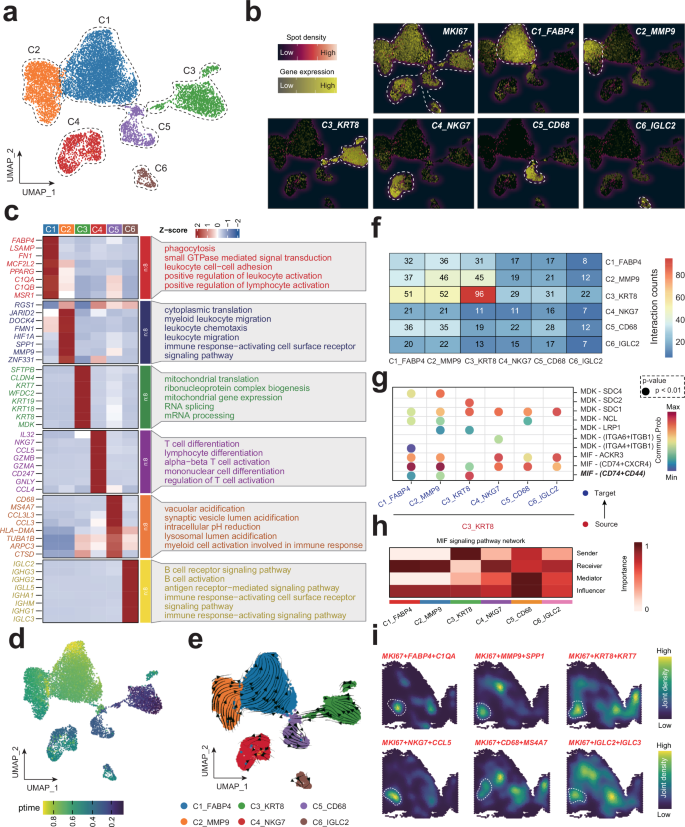
a UMAP plot of single-cell RNA sequencing data revealing distinct clusters of proliferating cells from various lung disease stages. Each point represents a cell, colored according to its cluster identity. b Heatmap displaying the expression of select marker genes characteristic of the annotated cell types within the identified clusters from the UMAP analysis. c Expression of significant markers and the enrichment of specific biological processes within each proliferating cell cluster. d, e SCTOUR algorithm depicts the development trajectory of various proliferating subtypes. f Intercellular communication analysis using CellChat, depicting signaling interactions among proliferating cell subsets. g Dot plot showing pair-ligands between C3_KRT8 and other subsets. h MIF signaling pathway network in proliferating cell subsets. i Spatial transcript analysis showing the joint density of various proliferating cell subsets.
Prognostic relevance of proliferating cell subtypes in LUAD
To unravel the clinical implications of various proliferating cell subtypes in LUAD, we leveraged the “Scissor” algorithm, a cutting-edge approach in single-cell data analysis, to pinpoint cell subgroups closely associated with distinct disease phenotypes within scRNA data. Our analysis revealed a predominance of Scissor+ labeled cells in clusters C2_MMP9 and C3_KRT8 (Fig. 3a, b). Of note, a total of 663 Scissor+ proliferating cell genes were identified (Fig. 3c and Table S5). Functional enrichment analysis hinted at an upregulation of cell-cycling and oncogenic pathways within the Scissor+ group, including the G2m Checkpoint and Epithelial-Mesenchymal Transition pathways, suggesting a potential role in the carcinogenesis and development of LUAD (Fig. 3d, e and Table S6).
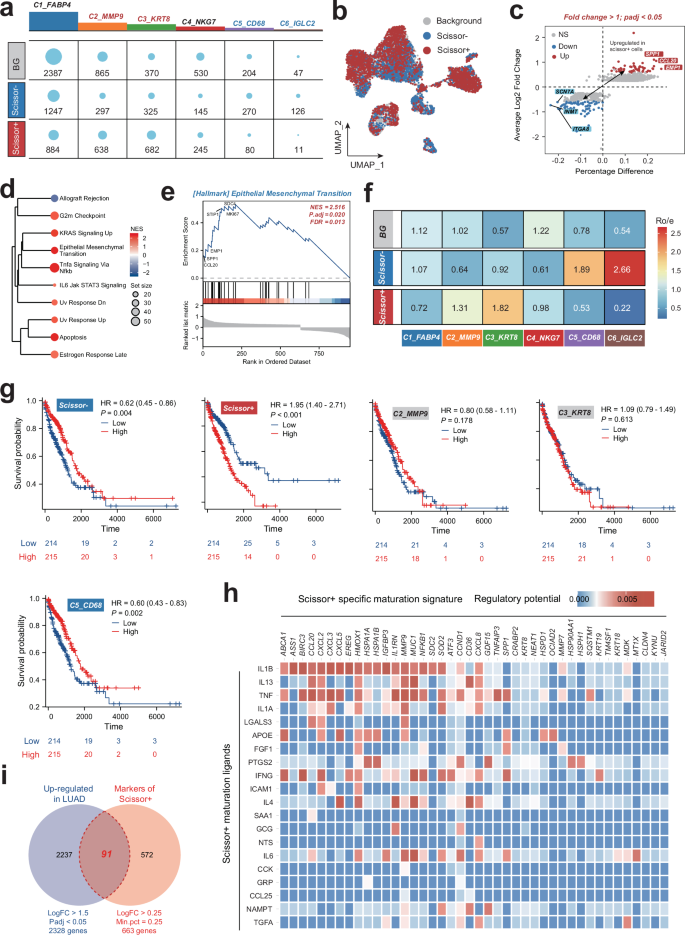
a Distribution of Scissor-, Scissor + , and backgroud (BG) proliferating cell numbers in each cell types. b UMAP plots showing the distribution of proliferating cells in various Scissor groups. c The differentially expressed genes in Scissor- and Scissor+ proliferating cells. d, e Hallmark enrichment analysis of the upregulated genes in Scissor+ group. f Heatmap showing tissue preferences of proliferating cell subtypes in each Scissor groups revealed by Ro/e. g Kaplan–Meier survival curves for LUAD patients stratified by the enriched scores of various proliferating cell subtypes calculate by the single-sample gene set enrichment analysis (ssGSEA) based on their significant markers. h Heatmap showing potential ligands driving the phenotype of Scissor+ proliferating cells inferred by NichNet analysis. i Venn plot showing the intersection of the LUAD-upregulated genes and the Scissor+ proliferating cell-associated markers. LUAD lung adenocarcinoma.
Employing the Ro/e algorithm, we observed a distinct distribution of proliferating cell subsets across Scissor groups. Notably, clusters C2_MMP9 and C3_KRT8 were significantly enriched in the Scissor+ group, while C1_FABP4, C5_CD68, and C6_IGLC2 subtypes were particularly enriched in the Scissor- group. This divergence in enrichment patterns may indicate varying prognostic impacts in LUAD, with the presence of subtypes like C2_MMP9 and C3_KRT8 in the Scissor+ group potentially indicating a more aggressive phenotype. To further identify the prognostic role of various proliferating subsets in LUAD, single-sample gene set enrichment analysis (ssGSEA) was applied to LUAD samples in the TCGA-LUAD dataset to calculate scores for various proliferating cell subtypes based on the top 200 significant genes (Table S7). Patients were categorized into score-low and score-high groups, with their prognosis correlation subsequently analyzed. Interestingly, only the Scissor+ proliferating cells group was associated with an unfavorable prognosis in LUAD. Importantly, NicheNet analysis predicted that IL1B ligands may drive the specific phenotype of Scissor+ proliferating cells, offering a potential therapeutic target for this aggressive subtype (Fig. 3h).
Regulation mechanism of scissor+ proliferating cells and its cellular communication networks in LUAD
Previously, our analysis identified IL1B as a potential key ligand regulating the specific phenotype of Scissor+ proliferating cells (Fig. 3h) using Nichenet analysis. To validate the scientific rationale of this hypothesis, we examined the expression of IL1B and its receptor (IL1RL1, ADRB2, IL1R2 and IL1R1), as well as the IL1B ligand-recepotor score (IL1BRCscore) calculated by AddModuleScore, along with well-known cell cycle and proliferation-related genes such as CCND1 and MKI67, across various proliferating cell subsets. Intriguingly, we found that these factors exhibited the highest and most specific expression in the primary subsets of the Scissor+ group, C2_MMP9 and C3_KRT9 (Fig. 4a), suggesting that IL1B may play a critical role in regulating the phenotype of Scissor+ proliferating cells.
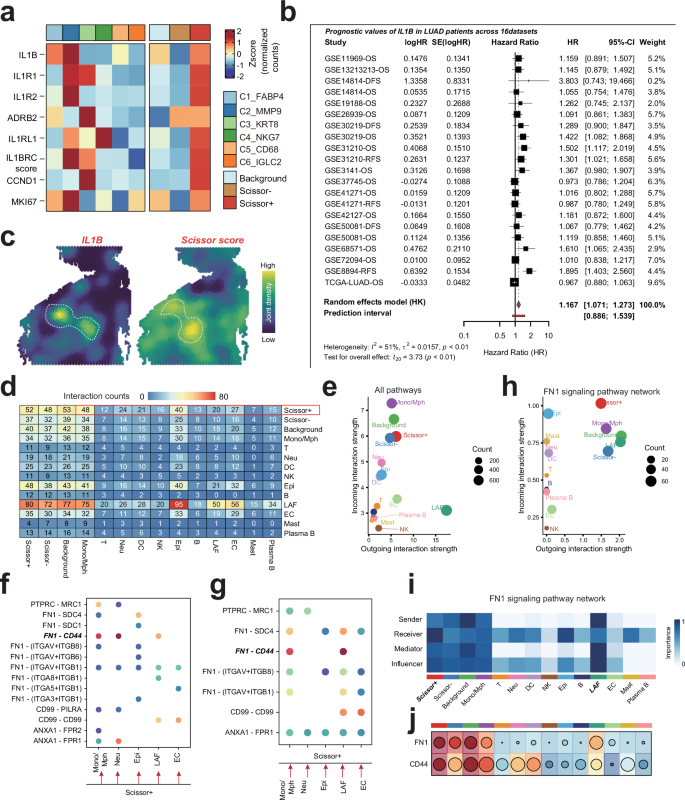
a Heatmap displays the expression of IL1B and its receptors (IL1RL1, ADRB2, IL1R2, IL1R1) along with the IL1B ligand-receptor score (IL1BRCscore) and proliferation-related genes (CCND1, MKI67) across different proliferating cell subsets. b Meta-analysis of IL1B expression in LUAD cohorts. A forest plot summarizing the hazard ratios (HR) and 95% confidence intervals (CI) for IL1B expression across 16 LUAD cohorts. c Spatial colocalization analysis of IL1B and Scissor score in LUAD samples, supporting the hypothesis that IL1B regulates the phenotype of Scissor+ proliferating cells. d Schematic representation of cellular communication networks in LUAD. Scissor+ subsets predominantly function as signal senders, while immune cells (Mono/Mph), epithelial cells, and stromal cells (LAF and EC) act as signal receivers. e Interaction network highlighting frequent intercellular communication between Scissor+ subsets and other cell types within LUAD. f, g Analysis of the FN1-CD44 axis in cellular interactions. The FN1-CD44 axis was identified as a key mediator of interactions between Scissor+ subsets and other cells, with bidirectional signaling observed. h, i FN1 signaling pathway network illustrating the primary signal senders and receivers. LAF was identified as the main signal sender, while Scissor+ subsets predominantly functioned as receivers. j Heatmap showing the expression of FN1and CD44 in various cell types of lung diseases.
We further assessed the prognostic value of IL1B in LUAD through a meta-analysis of 16 LUAD cohorts using a forest plot (Fig. 4b). The results indicated that high expression of IL1B was significantly associated with poor survival in LUAD patients (HR = 1.167, 95% CI: 1.071–1.273, p < 0.01). Despite some degree of heterogeneity among cohorts, the overall findings to some extent, at least suggest that IL1B could serve as a negative prognostic biomarker for LUAD patients. Notably, we observed a substantial spatial colocalization between IL1B and Scissor score in LUAD samples, further supporting that IL1B may regulate the specific phenotype of Scissor+ proliferating cells. However, these findings warrant further validation in the context of clinical settings and future research.
To elucidate the mechanisms by which proliferating cells influence LUAD prognosis, we investigated the cellular communication between proliferating cells and other cell types within LUAD. We found that the Scissor+ subsets predominantly acted as signal senders, while immune cells (Mono/Mph), epithelial cells, and stromal cells (LAF and EC) served as signal receivers, with frequent intercellular communication occurring between them (Fig. 4d, e). Further analysis revealed that the FN1-CD44 axis may play a crucial role in the interactions between Scissor+ subsets and these cells, with bidirectional signaling occurring (Fig. 4f, g). Notably, LAF was identified as the primary signal sender, while Scissor+ subsets predominantly functioned as receivers (Fig. 4h, i). The expression specificity of FN1 and CD44 across different cell subpopulations was consistent with this hypothesis (Fig. 4j). Previous studies have shown that the FN1-CD44 ligand-receptor pair is involved in cell adhesion, migration, and invasion19. Therefore, LAF may interact with Scissor+ subsets via the FN1-CD44 axis, thereby enhancing their proliferative and invasive capabilities and promoting LUAD progression.
Prognostic significance of Scissor+ proliferating cell genes in LUAD
To gain insights into the prognostic implications of diverse proliferating cell subtypes in LUAD, we intersected a set of 2328 tumor-regulated genes with 663 Scissor+ proliferating cell genes, yielding 91 potential prognostic genes that were carried forward into subsequent analyses (Fig. 3i). A focused Cox regression analysis within the TCGA-LUAD cohort narrowed down these to 22 candidate model genes. We further advanced our analysis by employing machine-learning techniques to pinpoint model genes with predictive potential. Within the TCGA-LUAD training cohort, we developed a robust predictive model, integrating 111 machine learning algorithms through the MIME package. The predictive prowess of each model was gauged by calculating the average C-index across all cohorts (Fig. 5a). Our research identified the Lasso + SuperPC combination as superior in TCGA, GSE31210, GSE50081, GSE72094, and META cohorts, indicating its enhanced prognostic capacity. This combination was thus selected for deeper analysis. The partial probability deviation in the LASSO regression was minimized by optimizing the penalty parameter lambda using 10-fold cross-validation (Fig. 5b). This process identified five model genes, namely FAM83A, ANLN, HMGA1, ECT2, and PRC1 that demonstrated decisive values across all LUAD cohorts by Cox regression analysis (Fig. S2). Moreover, the SPRS calculated using the Lasso + SuperPC combination exhibited a high C-index, showcasing great prognostic discrimination across each cohort (Fig. 5c, d). Notably, the identified combination also demonstrated great 1-year area under the curve (AUC) among various LUAD cohorts (Fig. 5e). To ascertain the prognostic impact of SPRS, we performed a meta-analysis of univariate COX regression via Mime, which revealed that the score calculated by SPRS is a potent prognostic indicator for LUAD patients (Fig. 5f, g). Moreover, we conducted a meta-analysis of the univatiate cox survival analysis among the SPRS in 20 LUAD cohorts to extend and validate the prognostic values of SPRS in LUAD (Fig. S3).
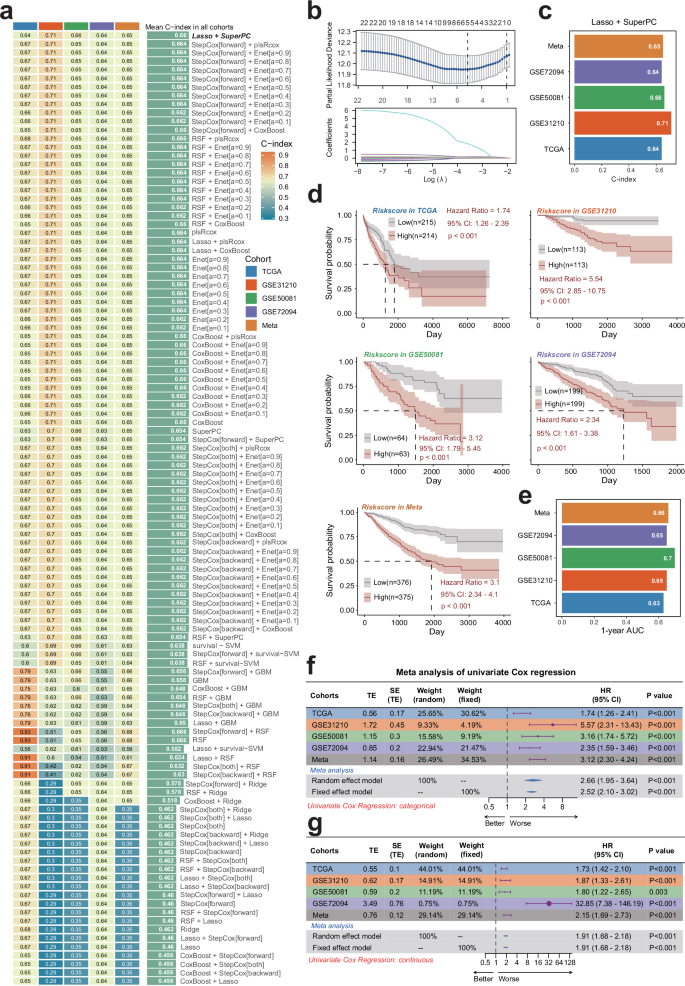
a Through a comprehensive computational framework, a combination of 111 machine learning algorithms was generated. The C-index of each model was calculated through the TCGA-LUAD, GSE31210, GSE50081, GSE72094, and META-LUAD (batch effects-removed combination of GSE31210, GSE50081and GSE72094) cohorts and sorted by the average C-index of the validation set. b The hub gene selected through the LASSO regression. c The C-index of SPRS calculated by Lasso+SuperPC algorithm across each datasets. d The relation between SPRS calculated by Lasso+SuperPC combined model and outcome of patients in different cohorts. e 1-year AUC of Lasso+SuperPC combined model among different cohorts. f, g Meta-analysis of univariate Cox result of Lasso+SuperPC combined model among different cohorts. LUAD lung adenocarcinoma, SPRS Scissor+ proliferating cell risk score.
Interestingly, the five SPRS model genes exhibited significantly higher protein expression in LUAD tissues compared to normal controls (Fig. S4a), consistent with their mRNA upregulation. Furthermore, elevated protein levels of FAM83A, ANLN, and ECT2 were significantly associated with poorer prognosis in LUAD patients (Fig. S4b). Strikingly, all model genes showed strong positive correlations with cell cycle progression and EMT-related pathways (Fig. S4c), suggesting that these genes may collectively drive tumor aggressiveness by coordinately regulating proliferative and metastatic programs in LUAD.
Spatial profiling of SPRS activity and its association with LUAD malignancy and immune microenvironment
To elucidate the spatial distribution of SPRS activity within LUAD tissues, we employed the AUCell algorithm to determine AUC scores for SPRS using spatial transcriptomics data from GSE17957220 (Fig. S5a). Deconvolution analysis was subsequently conducted to delineate the cellular composition within each spatially resolved tissue spot (Fig. S5b). Intriguingly, elevated SPRS AUC scores were predominantly observed in malignant and mixed malignant regions (Fig. S5c). Spearman correlation analysis further revealed a robust correlation between SPRS AUC scores and the abundance of tumor cells, macrophages, dendritic cells (DCs), and neutrophils within the LUAD microenvironment (Fig. S5d). This suggests that SPRS activity is preferentially localized to tumor cell populations and may contribute to the establishment of an immune-suppressive microenvironment.
Moreover, individual analysis of LPPG model genes demonstrated significantly higher expression levels in malignant and mixed malignant regions compared to normal tissue spots (Fig. S5e, f), with peak expression observed in purely malignant regions (Fig. S5g). Correlation analyses of all five SPRS components consistently echoed these findings, confirming their heightened activity within tumor cells (Fig. S5h). Collectively, these results position SPRS as a promising biomarker for evaluating LUAD malignancy and underscore its intricate interplay with the tumor microenvironment.
Validation of the clinical significance of SPRS
To substantiate the prognostic accuracy of the SPRS model for LUAD, an extensive review of the pertinent literature within the past half-decade was conducted. In this analysis, the SPRS’s C-index was compared against 30 established mRNA-related prognostic profiles in LUAD. Remarkably, the SPRS surpassed these existing models in predicting LUAD outcomes across all datasets evaluated (Fig. 6a, b). Univariate and multivariate Cox regression analyses confirmed SPRS as an independent risk factor, distinct from traditional clinical parameters (Table S8).
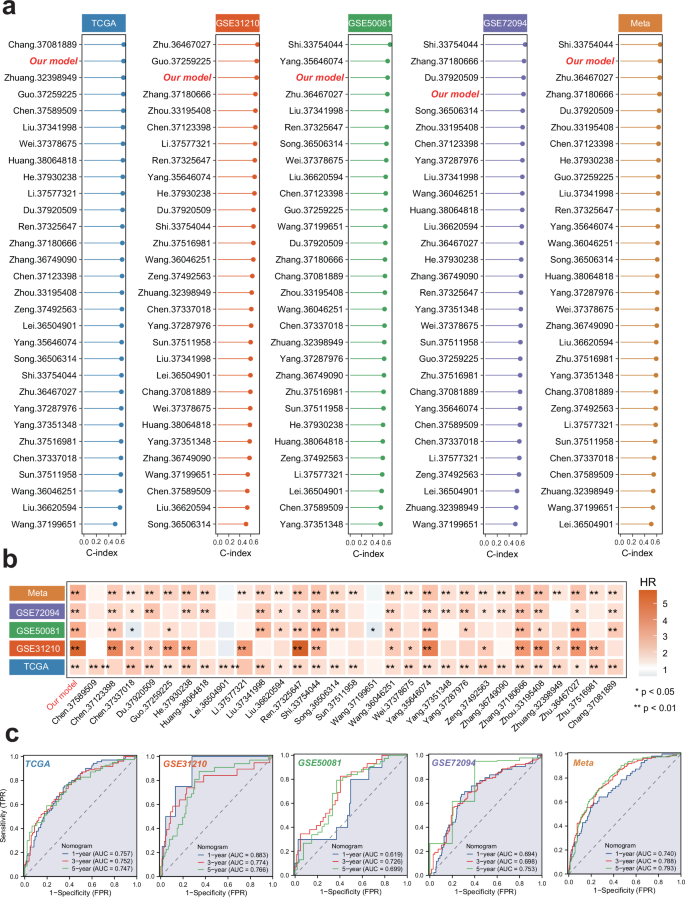
a C-index of SPRS and 30 published models across the training and 4 testing datasets. b HR of SPRS and 30 published models across the training and 4 testing datasets. SPRS, Scissor+ proliferating cell risk score. c ROC curve of the established nomogram model based on the SPRS and relevant clinical parameters in the training and 4 testing datasets. LUAD, Lung Adenocarcinoma; ROC, Receiver operating characteristic; SPRS, Scissor+ proliferating cell risk score.
Moreover, we constructed a nomogram model within the TCGA cohort, utilizing multivariate Cox and stepwise regression analysis to forecast 1-year, 3-year, and 5-year survival of LUAD patients. This model incorporated T stage, N stage, M stage, and SPRS as risk factors (Fig. S6a). The calibration curve validated the model’s accuracy against actual outcomes (Fig. S6b). K-M curves underscored the model’s clinical relevance (Fig. S6c). An assessment of the AUC values for the TCGA-LUAD cohort revealed that the nomogram model significantly enhanced the precision of OS predictions for LUAD patients (Fig. 6c). The predictive power of SPRS was also corroborated across additional LUAD cohorts, including GSE31210, GSE50081, GSE72094, and META, suggesting that SPRS holds value in prognostication across diverse patient groups (Fig. S6d–o and Fig. 6c). Therefore, the SPRS not only outperforms existing models but also provides a robust tool for differentiating LUAD prognosis, offering a potentially transformative approach to patient risk stratification and therapeutic planning.
Immune landscape of SPRS in LUAD
To explore the prognostic implications of the SPRS in LUAD, we conducted a thorough examination of the TIME using the “IOBR” R package, which integrates multiple algorithms for a comprehensive analysis of immune cell infiltration. Our findings revealed a significant increase in the levels of immune cells, including CAFs and MDSCs in patients with higher SPRS, pointing to an immunosuppressive microenvironment. This association suggests that a high SPRS may be linked to advanced immunosuppression mechanisms, which could be a critical factor in LUAD progression (Fig. 7a–d). Further analysis of immunotherapy-related biomarkers within the high SPRS group indicated an upregulation of these markers, potentially due to immune evasion strategies employed by the immunosuppressive TIME (Fig. 7b). Intriguingly, our data also demonstrated a positive correlation between high SPRS and elevated TMB and TNB, implying that an inflamed TIME with increased TMB might drive a more active adaptive immune response, which in turn could lead to enhanced immune evasion (Fig. 7e, f). This paradox highlights the complexity of the tumor microenvironment and suggests that high TMB alone may not be a sufficient predictor of ICB efficacy21. Further research is needed to explore the intricate relationships between TMB, SPRS, and immune evasion mechanisms to better understand their collective impact on treatment outcomes.
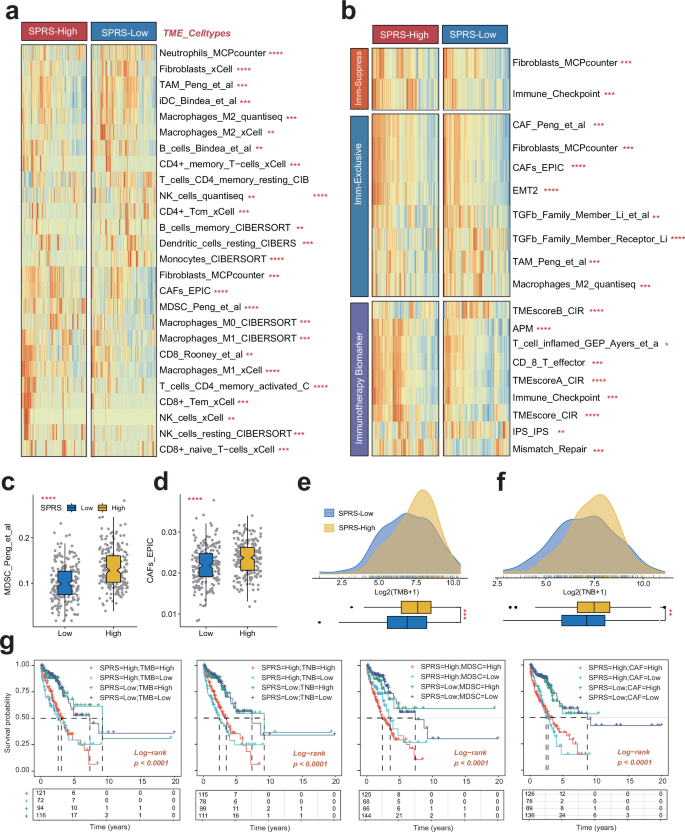
a The distribution of TME immune cell type signatures between high- and low-SPRS patients in LUAD. b The distribution of immune suppression, immune exclusion, and immunotherapy-related signatures between high- and low-SPRS patients in LUAD. c, d The distribution of TMB and TNB between high- and low-SPRS patients in LUAD. e, f The distribution of MDSC and CAF between high- and low-SPRS patients in LUAD. g Survival analysis combined SPRS with TMB, TNB, MDSC, and CAFs in LUAD patients. LUAD lung adenocarcinoma, SPRS Scissor+ proliferating cell risk score, CAFs cancer-associated fibroblasts, MDSCs myeloid-derived suppressor cells, TMB tumor mutational burden, TNB tumor neoantigen burden; *p < 0.05, **p < 0.01, ***p < 0.001, ns not significant.
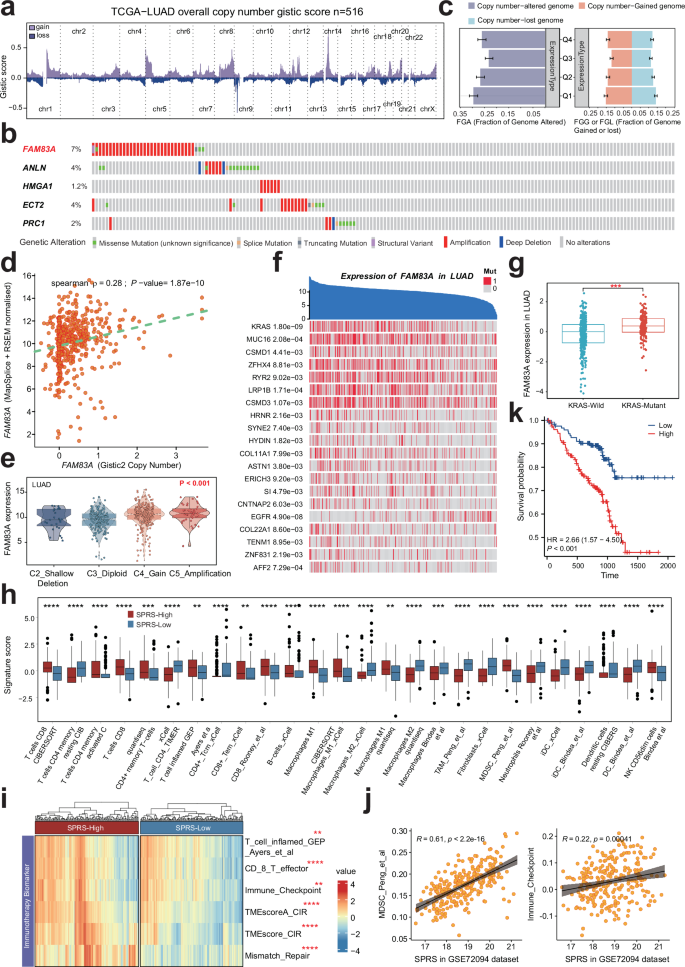
a This diagram shows the copy number variation in the genomes of 516 samples from the TCGA-LUADproject. The x-axis in the figure marks the different chromosome numbers, and the y-axis represents the gistic score values. Red bars indicate a higher gistic score (increase in copy number), and cyan bars indicate a lower gistic score (decrease in copy number). b Mutation profile and frequencies of SPRS model genes in LUAD from the cBioPortal database. c Percentage of FGL, FGG, and FGA in FAM83A expression subsets for LUAD. d Correlation analysis of Gistic2 gene copy number variation score and FAM83A gene expression in LUAD scatter plot. Each point in the graph represents a sample, the x-axis represents the gene copy number score calculated by Gistic2, and the y-axis represents the corresponding gene expression. e Differential expression of FAM83A between various copy number type. f Correlation of FAM83A expression levels and specific genetic mutations in LUAD.The blue area at the top represents individual patient samples, and the y-axis represents the FAM83A expression level of the samples, arranged in reverse order. The red vertical line below represents the mutated gene, otherwise the wild type (gray). g The distribution of median, quartile and data is presented to explore the difference in the distribution of FAM83A gene expression in wild-type (blue) and mutant (red) KRAS cells. ***, p < 0.001. h Validation of the correlation between SPRS and TIME in LUAD patients without KRAS mutation in GSE72094 cohort. i The distribution of immunotherapy-related signatures between high- and low-SPRS patients in LUAD patients without KRAS mutation in GSE72094 cohort. j Scatter plot shows the correlation between SPRS levers and immune checkpoint molecules as well as the MDSC infiltration levers in LUAD patients without KRAS mutation in GSE72094 cohort. k Kaplan–Meier survival curves for patients with low and high SPRS in LUAD patients without KRAS mutation in GSE72094 cohort.
Survival analysis confirmed that SPRS could serve as a valuable complementary factor to TMB, TNB, CAFs, and MDSCs in predicting patient outcomes. LUAD patients with lower SPRS, along with reduced TMB or TNB, or decreased infiltration of CAFs or MDSCs, exhibited a more favorable survival prognosis (Fig. 7g). This suggests that SPRS could be a potent immunological factor for stratifying LUAD patients and informing treatment strategies.
Alteration landscape of SPRS model genes in LUAD
Overall, the analysis of samples from the TCGA-LUAD project revealed multiple chromosomal copy number variations (Fig. 8a). Notably, FAM83A exhibited the highest mutation rate (7%) in LUAD, primarily through amplifications (Fig. 8b). The genomic alteration rate was higher in the top 25% of samples exhibiting elevated FAM83A expression, with increased proportions of both losses and gains (Fig. 8c). Furthermore, in LUAD, the Spearman rank correlation coefficient between the Gistic2-calculated FAM83A copy number score and FAM83A mRNA expression levels was 0.28, indicating a moderate positive correlation (Fig. 8d). notably, FAM83A expression showed an increase trend from homozygous deletions to high copy number amplifications (Fig. 8e). Additionally, numerous mutations associated with FAM83A expression were identified, with the top three being KRAS, MUC16, and CSMD1 (Fig. 8f). Multiple studies have indicated that mutations in KRAS22, MUC1623, and CSMD124 not only promote tumor progression but may also undermine the efficacy of immunotherapy. Moreover, a Wilcoxon rank-sum test revealed significant differences in FAM83A expression levels between KRAS wild-type and mutant patients, with FAM83A expression significantly higher in KRAS mutant patients. This finding suggests that KRAS mutations may regulate FAM83A expression, impacting patient prognosis (Fig. 8g). Thus, elevated FAM83A expression likely reflects enhanced proliferation activity, genomic instability, and heterogeneity within these tumor cells, all of which are associated with poor prognosis and resistance to treatment. Therefore, a more precise and personalized treatment approach may be necessary for these patients.
Moreover, it is noticeable that the analyses performed above did not differentiate between cases with and without driver gene mutations or alterations, such as KRAS. It is well established that the TIME varies between these groups, and patients with driver gene mutations generally exhibit lower responsiveness to immunotherapy compared to those without such mutations or alterations. In the current study, we found that KRAS mutations significantly influenced the prognosis of patients in the GSE72094-LUAD cohort. To eliminate potential confounding factors related to KRAS mutations, we further validated the correlation between SPRS and TIME in patients without KRAS mutations. Our findings indicated a trend similar to that observed in the TCGA-LUAD cohort (Fig. 8h), where the group with high SPRS displayed an immunosuppressive microenvironment characterized by greater infiltration of tumor-associated macrophages (TAM) and MDSC, along with elevated expression of immune checkpoint molecules (Fig. 8i, j) and worse clinical outcomes (Fig. 8k). These findings suggest that the SPRS model remains a robust predictor of the tumor immune microenvironment in LUAD, even after excluding the influence of driver gene mutations such as KRAS, thereby highlighting its potential utility in guiding more tailored and personalized treatment strategies for LUAD patients.
SPRS as a predictor for personalized LUAD therapy response
To evaluate the clinical relevance of the SPRS in LUAD immunotherapy, a meticulous analysis of the IMvigor210 cohort was undertaken. This analysis aimed to discern the prognostic and therapeutic implications of SPRS in LUAD patients. A comparative analysis of survival rates between patients with high and low SPRS revealed a significant difference, with the low SPRS group exhibiting more favorable outcomes (HR = 1.80, p < 0.001; Fig. 9a). This correlation was further supported by the observation that a lower SPRS correlated with improved responses to immunotherapy in the IMvigor210 cohort, as indicated by the Wilcoxon rank-sum test (p = 0.0019, Fig. 9b). To reinforce these findings, the analysis was expanded to other independent additional immunotherapy cohorts, including GSE91061 and GSE78220. Consistent with our initial observations, patients with higher SPRS scores were associated with poorer clinical outcomes compared to those with lower SPRS (Fig. 9c, d). GSEA identified the enrichment of EMT and cell cycle-related pathways, including E2f targets, G2m checkpoints, and Myc target V1, in the high SPRS groups (Fig. 9e). These findings suggest that patients with elevated SPRS may exhibit a more aggressive disease phenotype, potentially due to enhanced immune evasion mechanisms.
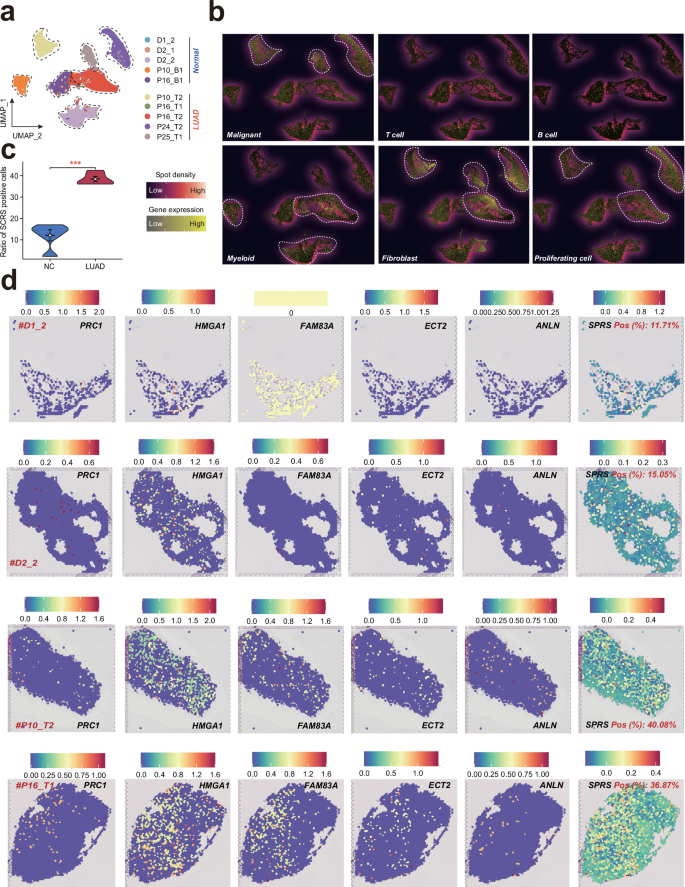
a UMA plots showing spots from all sections, color-coded according to their sample source. b Signature-based strategy to assessthe enrichment of various cell types within each spot. c Comparisons of SPRS positive cell ratios between cancer and noncanceroustissues. d Expression of the five SPRS model genes and SPRS score in each spot across samples. LUAD lung adenocarcinoma, SPRS scissor+ proliferating cell risk score, UMAP uniform manifold approximation and projection.
To identify potential therapeutic strategies for LUAD patients with high SPRS, the GDSC database was utilized to screen for drugs that may be sensitive to this patient subgroup. The analysis revealed a negative association between SPRS and several drugs, including cisplatin, docetaxel, paclitaxel, and gefitinib, suggesting a potential increased sensitivity to these chemotherapeutic and targeted therapies in LUAD patients with high SPRS (Fig. 9f, g and Table S9). Furthermore, given that PRC1 demonstrated the highest HR value based on univariate Cox regression analysis, its subcellular localization and protein level were examined using the HPA database. PRC1 was found to be primarily localized to the plasma membrane, microtubules, cytokinetic bridge, and midbody. Notably, PRC1 protein levels were elevated in LUAD tissues compared to normal tissues (Fig. 9h, i), implicating PRC1 as a potentially significant factor in LUAD progression and aggressiveness.
To strengthen the validity of our study, we used RT-qPCR to validate the expression of the identified model genes (Table S10). The expression levels of five SPRS model genes were evaluated in the clinical LUAD samples, including three adjacent cancer tissues and three cancerous tissues. All model genes showed an increasing trend in the LUAD tissues (Fig. 9j), consistent with our bioinformatic analysis, thereby reinforcing the credibility of our study.
Spatial transcriptomics unveils elevated SPRS in LUAD tissues
To elucidate the spatial distribution of SPRS in lung diseases, we conducted ST analysis on a diverse cohort of tissues, including three healthy lung samples, two adjacent non-cancerous tissues, and five LUAD tissues (Fig. 10a). Given the complexity inherent in each spatial spot, which may encompass multiple cell types, we employed a signature-based analytical approach to quantify the enrichment of various cellular components within each spot (Fig. 10b). Our analysis revealed significant heterogeneity among malignant cells, contrasting with the co-localization of fibroblasts and proliferating cells (Fig. 10b). Upon calculating the SPRS for each ST sample, we observed a notable elevation in both SPRS scores and the proportion of SPRS-positive cells in LUAD tissues compared to non-tumorous controls (Fig. 10c, d and Fig. S7a–f). These findings underscore the potential of SPRS as a spatial biomarker for LUAD, reflecting the intricate interplay between gene expression patterns and tumorigenesis.
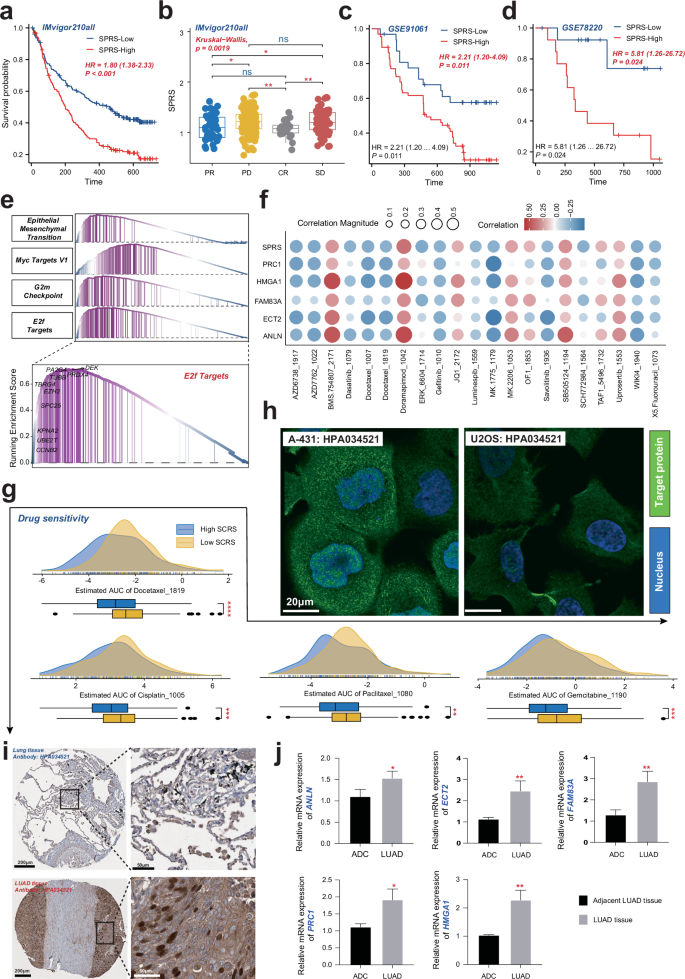
a Kaplan–Meier survival curves for patients with low and high SPRS from the IMvigor210 cohort, demonstrating differential survival probabilities. b Graphical representation of patient responses to immunotherapy, categorized by SPRS levels, with statistical significance indicated. c, d Comparative survival analysis from two independent cohorts (GSE91061 and GSE78220) showing the association between SPRS levels and survival outcomes. e GSEA plot showing the enrichment of cell cycle-related pathways in high SPRS LUAD samples. f Correlations between SPRS/model genes and IC50 of specific drugs from GDSC database. Red and blue dots indicate positive and negative correlations, respectively. g Ridge plot depicting the distribution of AUC values for various drugs, suggesting a link between SPRS and drug sensitivity. h Cellular localization of PRC1 protein in A-431 and U2OS from the HPA database. i Relative protein levels of PRC1 in LUAD tissue compared to a normal tissue, as determined by the HPA database. j Relative mRNA expression levels of five SPRS model genes in LUAD tissues compared to normal tissues, as determined by RT-qPCR. LUAD, Lung Adenocarcinoma; SPRS, Scissor+ proliferating cell risk score.
Multi-omics characterization of proliferating cell-driven immunosuppression across LUAD progression stages
The above results explored the role of proliferating cells in different stages of lung disease from a multi-omics perspective. However, the cohort of LUAD patients included only 15 individuals. We further extracted the LUAD samples from the test cohort and integrated them with a larger single-cell atlas of LUAD, reconstructing a dataset that includes different stages of LUAD, comprising 32 patients with Stage I, 5 with Stage II, 8 with Stage III, and 28 with Stage IV disease (Fig. 11a). Following a rigorous quality control process, we included a total of 259,254 high-quality single-cell profiles from LUAD patients, categorizing them into 15 distinct cell subpopulations based on their unique gene expression characteristics (Fig. 11b). Using the AddModuleScore algorithm, we calculated the SPRS score for each cell and categorized them into SPRS_high and SPRS_low groups based on median expression levels (Fig. 11c). Employing the Ro/e algorithm, we found that proliferating cells exhibited a significant tissue preference in later stages of LUAD (Stages II-IV), consistent with observations from the testing cohort. Additionally, patients categorized as SPRS_high had a higher enrichment of macrophages, CAFs, and proliferating cells (Fig. 11d), further revealing an immunosuppressive microenvironment associated with higher SPRS levels and resistance to immunotherapy.
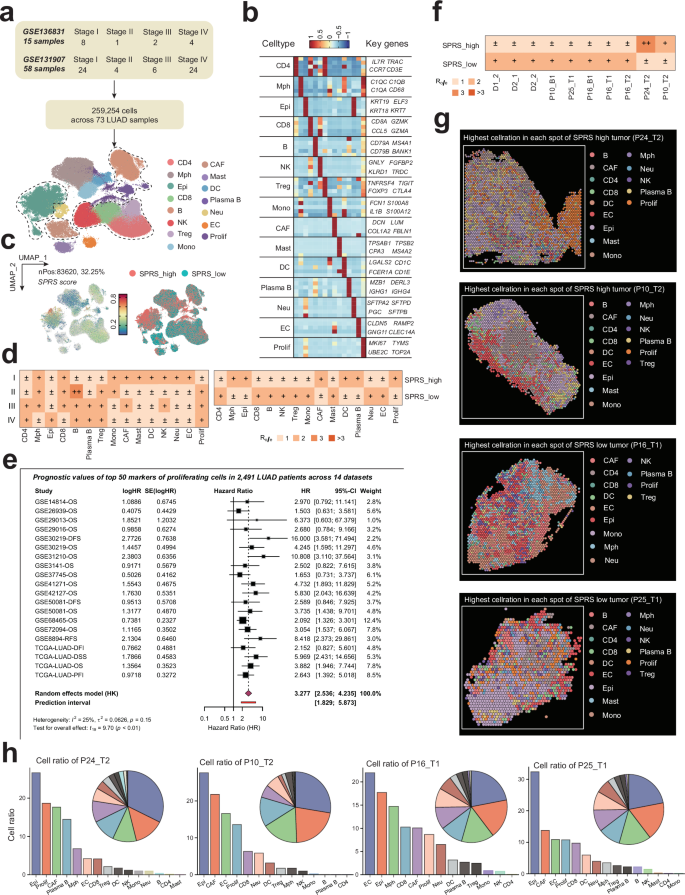
a Cohort composition and staging distribution of the integrated LUAD dataset (n = 73 patients: 32 Stage I, 5 Stage II, 8 Stage III, 28 Stage IV). b Uniform Manifold Approximation and Projection (UMAP) of 259,254 high-quality single-cell profiles from LUAD patients, annotated into 15 distinct cell subpopulations based on canonical marker genes. c Stratification of cells into SPRS_high and SPRS_low groups based on median AddModuleScore values. d Tissue preference analysis (Ro/e algorithm) revealing stage-dependent enrichment of proliferating cells in advanced LUAD (Stages II–IV) as well as relative abundance of macrophages, cancer-associated fibroblasts (CAFs), and proliferating cells in SPRS_high tumors. e Forest plot of meta-analysis (14 datasets, n = 2491 patients) demonstrating consistent association between proliferating cell marker expression and poor prognosis. f Spatial transcriptomics (ST) tissue preference of various samples in SPRS_high and SPRS_low tumors highlighted. g CellTrek-based deconvolution of ST spots. h Quantification of cell-type proportions in SPRS_high versus SPRS_low tumors, confirming immunosuppressive microenvironment features (elevated CAFs, reduced CD8 + T cells) observed in single-cell data.
We extracted the top 50 markers of proliferating cells from the validation cohort’s and discovered that the combined high expression of proliferation-related genes was significantly associated with poorer prognosis across 2,491 LUAD patients in 14 datasets (combined HR = 3.277, 95% CI: 2.536–4.235, p < 0.01), with low heterogeneity observed among different cohorts (I² = 25%). This indicates that comprehensive markers of proliferating cells can effectively distinguish high-risk patients and provide robust prognostic stratification (Fig. 11e).
To further analyze and verify the spatial organization of immune cell types in high- and low-SPRS tumors as well as to explore interactions between proliferating cells and the TIME in LUAD, we examined the spatial localization of SPRS-positive cells in tumor tissues and their associations with immune cell infiltration and tumor heterogeneity across the 10 LUAD ST samples. Similarly, we categorized each ST spot based on the median SPRS score into SPRS_high and SPRS_low groups. We identified samples #P24_T2 and #P10_T2 as high-SPRS tumors, while #P16_T1 and #P25_T1 were categorized as low-SPRS tumors, correlating with the observed differences in the proportions of SPRS-positive cells across the various ST samples (Fig. 9d and Fig. S5). Furthermore, using the CellTrek algorithm, we deconvoluted the cellular composition of the high and low-SPRS tumors (Fig. 11g) and found that high-SPRS samples exhibited a higher proportion of CAFs and a lower proportion of CD8 + T cells (Fig. 11h), corroborating the results observed at the single-cell level (Fig. 11d).