Experimental setup
The effectiveness of the proposed RMDNet model was evaluated through a series of systematic experiments conducted on three datasets: RBP-24, RBP-31, and the human subset of RBPsuite2. RBP-24 was used as a benchmark dataset to compare model accuracy within a unified evaluation framework. RBP-31 served as an independent test set to assess the model’s generalization capability on unseen RBPs. For the ablation study, we selected human RBPs from RBPsuite2 that did not overlap with either RBP-24 or RBP-31, ensuring dataset independence and avoiding information leakage. Furthermore, a downstream functional analysis based on YTHDF1 peak data was conducted to investigate the biological significance and practical utility of the model’s predictions.
Eight standard classification metrics were used in the evaluation: AUC, PR-AUC, Accuracy, Precision, Recall, Specificity, F1-score, and MCC. Different subsets of these metrics were emphasized depending on the experimental objective. Reported results represent the mean performance across the relevant RBPs. All models were implemented in PyTorch 1.13 and trained using an NVIDIA A100 GPU. The Adam optimizer was employed, with a learning rate selected from \(1 \times 10^{-3}\), \(1 \times 10^{-4}\) and a weight decay of \(1 \times 10^{-5}\). Early stopping was applied to prevent overfitting during training. To handle class imbalance, we used a weighted cross-entropy loss with class weights set inversely proportional to class frequencies. During inference, the IDBO algorithm was applied to search for optimal fusion weights across the three sequence branches, with AUC serving as the fitness function.
Baseline performance comparison on RBP-24
To comprehensively evaluate the effectiveness of the proposed RMDNet model in RNA–protein binding site prediction, we first conducted a standardized benchmark experiment on the RBP-24 dataset. This experiment was designed to provide a fair and systematic evaluation framework for comparing RMDNet against representative baseline models and to assess its accuracy and robustness across multiple classification metrics. We selected three baseline models for comparison: GraphProt [12], a classical method that incorporates both sequence and structural features for binding site prediction; and two recent deep learning-based models, DeepRKE [13] and DeepDW [14], both of which integrate RNA sequence and predicted secondary structure information and represent more advanced architectures. These models were chosen because they reflect three widely-adopted modeling paradigms in RNA–protein binding site prediction—traditional machine learning (GraphProt), graph-based deep learning (DeepRKE), and convolutional sequence modeling (DeepDW)—and have been extensively used in prior studies as benchmarking references.
A consistent training setting was adopted across all models, with the number of training epochs fixed at 30. For each RBP, model training and evaluation were independently repeated 15 times, and the average performance across these trials was reported to minimize the influence of randomness. In our model, the IDBO algorithm was applied during inference. The configuration in this experiment included a population size of 30, a one-dimensional search space, and 1000 iterations. This configuration was empirically validated by Zhang et al., who demonstrated that it achieves superior performance in similar optimization tasks. Given the inherent stochasticity of swarm intelligence algorithms, we performed repeated runs to reduce variance and enhance the stability and reliability of the evaluation results.
The experimental results are summarized in Figs. 2 and 3, with detailed performance statistics provided in Table 1. In addition, Table 2 reports the RMDNet performance for each individual RBP in the RBP-24 dataset across all eight evaluation metrics, providing a fine-grained view of prediction consistency and variability. Figure 2 compares the average values of eight standard classification metrics—AUC, PR-AUC, Accuracy, Precision, Recall, Specificity, F1-score, and MCC—across all models. Figure 3 presents two boxplots showing the distribution of AUC and MCC scores per RBP, highlighting the stability and generalization ability of each model. Table 1 lists the overall mean performance for each method, with the best result for each RBP highlighted in bold.
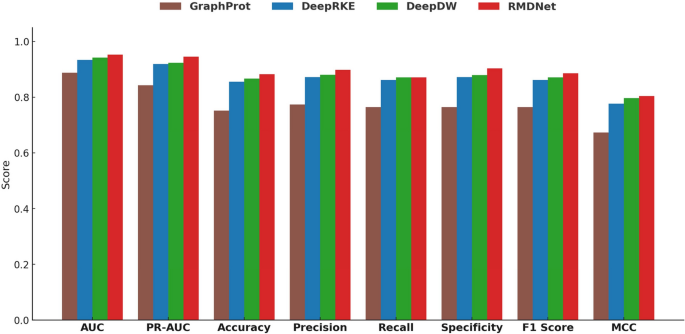
Comparison of average classification metrics among different models on the RBP-24 dataset. The bar chart includes eight standard metrics: AUC, PR-AUC, Accuracy, Precision, Recall, Specificity, F1-score, and MCC
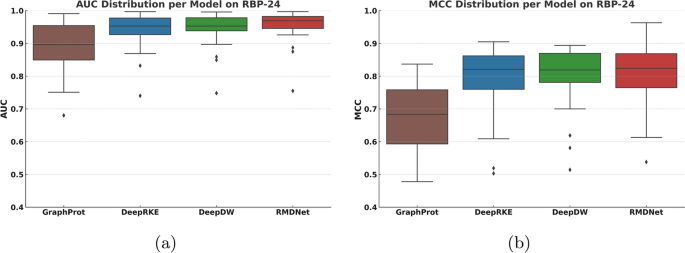
Distribution of AUC and MCC scores across different models on the RBP-24 dataset. Each boxplot summarizes the per-RBP performance for one evaluation metric, reflecting the stability and generalization ability of each model
Figure 2 shows that RMDNet consistently outperforms the baseline models—GraphProt, DeepRKE, and DeepDW—across all eight evaluation metrics. In particular, it achieves the highest scores in discriminative metrics such as AUC and PR-AUC, indicating superior capability in distinguishing binding from non-binding sites. RMDNet also obtains higher values in Accuracy, Precision, Recall, Specificity, F1-score, and MCC, confirming its robustness and overall reliability. Table 1 further supports these findings by reporting that RMDNet achieves the highest average scores across all metrics, with especially pronounced margins in AUC, PR-AUC, and F1-score. Compared with the classical method GraphProt, RMDNet shows substantial improvements in all aspects. Even when compared to the more advanced DeepRKE and DeepDW, which also incorporate sequence and structural features, RMDNet maintains a clear performance edge-particularly in metrics reflecting classification balance and consistency such as F1-score and MCC. These results suggest that the model’s dynamic fusion mechanism and structure-aware design contribute significantly to its superior predictive performance. To further illustrate this advantage, Table 2 presents the per-RBP results of RMDNet across the eight evaluation metrics, highlighting its effectiveness and stability across diverse proteins. For completeness, corresponding per-RBP results for the baseline models—GraphProt, DeepRKE, and DeepDW—are provided in Supplementary Note 3 Tables S1–S3.
Figure 3a, b show the distributions of AUC and MCC scores, respectively, across the 24 RBPs in the RBP-24 dataset. RMDNet achieves the highest medians and smallest interquartile ranges in both metrics, highlighting its consistent performance and generalization capability. In contrast, GraphProt exhibits the largest variance, while DeepRKE and DeepDW show relatively more stable but still wider distributions and lower median scores. Notably, several RBPs appear as outliers with lower performance across all models. One such case is ALKBH5, where all models show a performance decline. Despite the dataset being relatively class-balanced, the small sample size likely contributes to its higher sensitivity to performance variation and reduced generalizability. Even in this challenging scenario, RMDNet maintains relatively high scores, demonstrating its robustness in small-sample learning settings. To further assess generalization capability, we next evaluate the model on the RBP-31 dataset.
Generalization ability assessment on RBP-31
To assess the generalization ability of RMDNet beyond the RBP-24 benchmark, we performed additional experiments on the RBP-31 dataset, which comprises 31 RNA-binding proteins curated from diverse studies. All models were evaluated using the same training settings, optimization strategies, and evaluation metrics as in the RBP-24 experiments to ensure comparability and fairness. In this evaluation, we focused on the AUC metric to quantify generalization performance. AUC is widely recognized as a robust indicator of model discrimination capability, particularly in imbalanced classification scenarios. It also serves as a reliable proxy for evaluating performance consistency across heterogeneous RBP contexts.
The experimental results are summarized in Fig. 4 and Table 3. Figure 4 shows the AUC scores of four models—GraphProt, DeepRKE, DeepDW, and RMDNet—across all RBPs in the RBP-31 dataset. Detailed per-RBP AUC values for each model are listed in Table 3, with the best result for each RBP highlighted in bold.
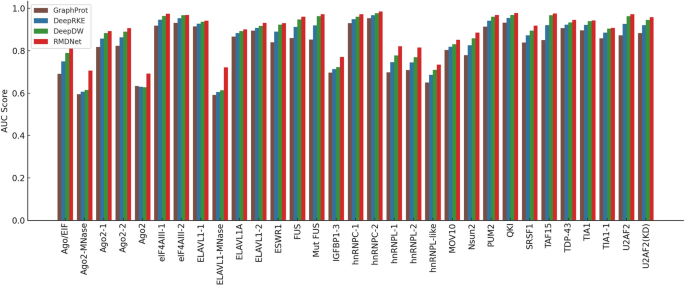
Comparison of AUC scores among different models on the RBP-31 dataset. The bar chart shows the AUC performance of four models—GraphProt, DeepRKE, DeepDW, and RMDNet—across 31 RNA-binding proteins
As shown in Fig. 4 and Table 3, RMDNet consistently achieved the highest AUC scores across the majority of RBPs in the RBP-31 dataset, significantly outperforming the baseline models GraphProt, DeepRKE, and DeepDW. The mean AUC of RMDNet reached 0.894, compared to 0.871 for DeepDW, 0.851 for DeepRKE, and 0.819 for GraphProt. These results highlight the superior generalization ability of RMDNet on previously unseen RNA-binding proteins. RMDNet also demonstrated stable and robust performance on particularly challenging proteins, such as ELAVL1-MNase and Ago2-MNase, where it outperformed the second-best method by margins exceeding 0.09. In contrast, the baseline models exhibited greater performance variability, especially when applied to low-signal or noise-prone datasets.
These findings confirm that RMDNet maintains consistent predictive quality across a diverse range of RBPs, reinforcing the effectiveness of its sequence?structure fusion and inference-time optimization strategies in cross-protein generalization tasks. To further examine the internal contribution of each model component, we conduct an ablation study in the next section.
Ablation study
We further performed ablation experiments using the human subset of the RBPsuite 2.0 dataset to systematically examine the contribution of each component in RMDNet. Two representative RBPs were selected: CPSF1, with a large sample size of 69,879 sequences, and FBL, with a smaller sample size of 7,472 sequences. These cases were chosen to evaluate model robustness under both large- and small-scale conditions. For each RBP, the dataset was split into training and testing sets in an 80:20 ratio. Specifically, CPSF1 contained 55,903 and 13,976 positive samples in the training and testing sets, respectively, while FBL contained 5,977 and 1,495. To ensure balanced binary classification, we generated negative samples at a 1:1 ratio using the pyfaidx toolkit for both training and testing phases. All training configurations—including the number of epochs, optimizer settings, and early stopping criteria—were kept identical to those used in the RBP-24 and RBP-31 experiments for consistency. This setup provides a controlled evaluation environment for assessing the individual effects of each branch, structural features, and the DBO-based fusion strategy on final model performance.
We constructed five ablation variants of RMDNet to examine the impact of individual architectural components. RMDNet-1 removes the CNN branch while retaining the CNN-Transformer and ResNet branches; RMDNet-2 removes the CNN-Transformer branch; RMDNet-3 removes the ResNet branch. RMDNet-4 excludes all GNN-derived structural features, and RMDNet-5 replaces the DBO-based fusion strategy with equal-weight averaging during inference. Three core evaluation metrics were selected: AUC, F1-score, and MCC. AUC reflects the model’s discrimination capacity regardless of threshold. F1-score captures the trade-off between precision and recall, especially relevant when working with synthetically generated negatives. MCC provides a balanced summary of classification performance under potential data imbalance or label noise. The results are summarized in Fig. 5, Table 4.
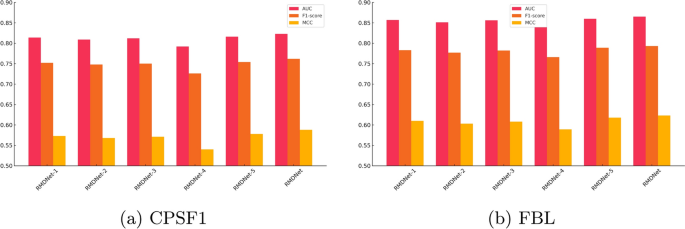
Comparison of AUC, F1-score, and MCC scores across different ablation variants of RMDNet on CPSF1 and FBL datasets. Each bar represents the average performance under one evaluation metric, illustrating the contribution of individual components and the robustness of the full model
As shown in Fig. 5a, b, and Table 4, the complete RMDNet model consistently outperforms all ablation variants across AUC, F1-score, and MCC. On the large-sample CPSF1 dataset, RMDNet achieves an AUC of 0.823, an F1-score of 0.762, and an MCC of 0.588. Removing any of the three sequence branches?CNN, CNN-Transformer, or ResNet?results in a measurable performance drop, demonstrating the complementary effect of multi-branch feature extraction. Excluding GNN-derived structure inputs leads to the most pronounced degradation, especially in MCC, highlighting the essential role of RNA secondary structure in improving classification balance. Substituting the DBO-based fusion strategy with equal-weight averaging also causes a slight decline, indicating the added value of adaptive inference-time optimization.
A similar trend is observed on the small-sample FBL dataset, where RMDNet again achieves the best performance: AUC of 0.865, F1-score of 0.793, and MCC of 0.623. Interestingly, these values slightly exceed those of CPSF1, despite the smaller dataset size. This differs from previous results on RBP-24, where larger sample sizes generally correlated with better accuracy. One possible explanation is that CPSF1, although large, may contain more heterogeneity or label noise, making learning more difficult. In contrast, the FBL dataset may present cleaner motif patterns and higher data consistency, enabling the model to generalize more effectively even with fewer training samples.
It is also noteworthy that RMDNet achieves substantial improvements over the average performance reported for RBPsuite 2.0. On the CPSF1 dataset, RMDNet’s AUC exceeds the reported mean AUC of 0.783 by approximately 4.0%, while on the FBL dataset, the improvement reaches 8.1%. These results further highlight the generalization capacity and adaptability of RMDNet across both favorable and challenging scenarios.
Visualization and functional validation of learned motifs
This section focuses on YTHDF1, a well-characterized N6-methyladenosine (m6A) reader protein that plays a pivotal role in post-transcriptional regulation and translation initiation. The dataset used for motif analysis was obtained from RBPsuite 2.0, a curated CLIP-seq-based resource that provides high-confidence binding annotations for RNA-binding proteins.
To interpret the internal representations learned by the model, we extracted representative sequence motifs from the CNN branch. Specifically, we analyzed the first convolutional layer by visualizing activation responses of individual kernels using RNA segments associated with YTHDF1 binding. A fixed window size of 101 nucleotides was used to capture local sequence patterns, which typically span 5 to 10 nucleotides. This shorter window helps avoid signal dilution and improves motif resolution. For each kernel, the top 30 most activated subsequences were aligned to generate a position frequency matrix, which was then converted into an information content profile (in bits) and visualized as a sequence logo. The vertical axis of each logo represents Shannon entropy, reflecting the degree of nucleotide conservation at each position. The complete motif logos extracted from all 16 CNN kernels are shown in Fig. 6.

Motifs learned by the CNN branch for YTHDF1. Sixteen sequence logos represent the binding patterns captured by each convolutional kernel
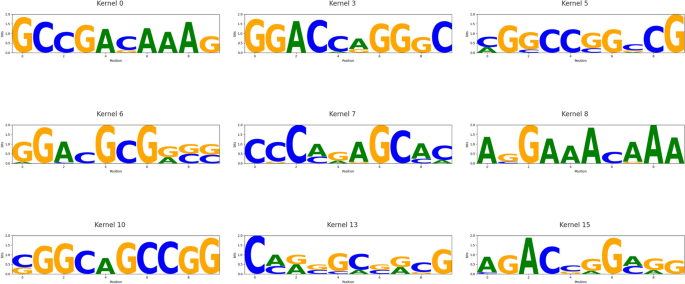
Reliable motifs with significant matches to known RBP patterns. Nine sequence logos correspond to CNN kernels whose motifs aligned with entries in the CISBP-RNA database (E-value < 0.05)
Among the 16 CNN kernels, nine (kernel 0, 3, 5, 6, 7, 8, 10, 13, and 15) produced high-quality, biologically interpretable motifs. These motifs were systematically compared against the CISBP-RNA database using a Tomtom-style alignment framework. Evaluation was based on the E-value, which estimates the expected number of false positives under a random match assumption. An E-value below 0.05 was considered statistically significant. Under this criterion, kernel 0 and kernel 15 identified canonical DRACH-like motifs such as ACA and ACG, consistent with known m6A recognition elements associated with YTHDF1. Kernel 5 and kernel 10 matched GC-rich elements related to HNRNPC, kernel 7 captured AU-rich patterns consistent with HuR recognition, and kernel 13 aligned with GGA-rich motifs characteristic of FUS and other FET family proteins. The nine motifs with strong alignment results are visualized in Fig. 7, representing biologically meaningful matches. These findings indicate that our model not only achieves high predictive performance but also learns sequence motifs that align with experimentally validated RBP binding preferences, enhancing its interpretability and functional relevance. Furthermore, several of the matched motifs are known to participate in biologically critical processes. For instance, DRACH-like motifs recognized by YTHDF1 are associated with enhanced translation efficiency in mRNAs [27], while AU-rich sequences targeted by HuR have been linked to mRNA stability and inflammation-related gene expression [28]. These associations support the biological relevance of the learned patterns and their potential roles in disease regulation.
Case study: interpretable binding pattern analysis of YTHDF1
We conducted a case study on the RNA-binding protein YTHDF1 to evaluate the practical applicability and interpretability of the proposed model. YTHDF1 is a well-established reader of N6-methyladenosine (m6A) modifications and plays a critical role in post-transcriptional regulation across multiple biological contexts, including cancer. Its biological significance makes it a relevant target for downstream prediction and visualization.
This section presents two key visualizations derived from real YTHDF1 prediction results: a binding site distribution plot and a prediction score heatmap. The distribution plot summarizes the positional frequencies of high-confidence binding sites across normalized RNA sequences, while the heatmap reveals the intensity and spatial trends of predicted binding across a large sample set. Together, these visualizations provide insight into the model’s ability to identify biologically meaningful features, such as motif enrichment and spatial binding preferences, within realistic biological data.
The input dataset for YTHDF1 consisted of 266,977 RNA subsequences generated using a sliding window approach. A window size of 101 nucleotides was chosen to balance the need for capturing sufficient local context with maintaining computational efficiency. This length adequately spans typical RBP binding motifs (approximately 6–10 nucleotides), while also enabling multiscale feature modeling and structural graph construction. Given the large dataset size, directly visualizing predictions for all sequences may result in memory overload or rendering failure. To mitigate this, 10,000 RNA fragments were randomly sampled to represent the full dataset in downstream analyses. For the binding site distribution plot, each RNA sequence was normalized to a fixed length of 200, and all nucleotide positions with predicted scores \(\ge 0.8\) were collected. Although the plot appears as a single curve, it is in fact an aggregation across thousands of samples, serving as a compressed yet informative summary of large-scale prediction results. This approach highlights consistent binding hotspots while minimizing computational overhead.
To biologically contextualize the distribution, we compared the predictions with experimentally validated YTHDF1 binding sites from the POSTAR3 CLIP-seq dataset. For each CLIP peak, the midpoint was calculated as \((\text{start} + \text{end}) / 2\) and mapped to the normalized 200-length coordinate system using the following equation:
$$\begin{aligned} \text{normalized position} = \left( \frac{\text{center} – \text{fragment start}}{\text{fragment length}} \right) \times 200 \end{aligned}$$
(19)
Similarly, to generate a clearer and more interpretable prediction score heatmap, we employed a sparse aggregation strategy. Specifically, every 20 RNA sequences were grouped into a batch, resulting in 500 groups (\(N = 500 \times 20\)). For each group, the average predicted binding scores were computed across the 200 normalized nucleotide positions, forming a \(500 \times 200\) heatmap matrix. This approach effectively preserves the overall predictive trends while reducing visual clutter, enabling scalable and structured interpretation of binding signal intensity across a large number of RNA sequences.

Visualization of binding site distribution and prediction score heatmap for YTHDF1 on real RNA sequences. The histogram shows the frequency of high-scoring binding positions (score \(\ge 0.8\)) across normalized RNA regions, while the heatmap aggregates 10,000 predicted sequences into 500 groups, highlighting consistent positional patterns. These visualizations reflect the model’s spatial sensitivity and downstream interpretability
Figure 8 illustrates the downstream prediction performance of our model on real YTHDF1 RNA sequences. Figure 8a presents the binding site distribution plot, which summarizes the frequency of high-confidence binding positions (predicted scores \(\ge 0.8\)) across normalized RNA fragments of fixed length 200. The results exhibit a pronounced central enrichment pattern, with high-scoring positions predominantly concentrated near position 100, spanning approximately positions 85 to 115. To biologically validate this enrichment, we extracted YTHDF1 CLIP-seq peaks from the POSTAR3 database. The center of each peak was mapped to the normalized coordinate system, revealing that the majority clustered around position 99. Accordingly, we shaded the region from position 98 to 100 in Fig. 8a to indicate the experimentally supported binding zone. The predicted peak closely overlaps with this interval, indicating that the model captures real binding preferences with high spatial precision. This spatial bias demonstrates the model’s ability to detect meaningful binding hotspots, rather than uniformly distributing predictions along the sequence. Furthermore, the observed pattern is consistent with YTHDF1 binding profiles reported in previous CLIP-seq studies, underscoring the model’s sensitivity to biologically relevant sequence features.
Figure 8b shows the sparse prediction score heatmap, constructed from 10,000 RNA samples aggregated into 500 groups by averaging every 20 sequences. The heatmap reveals a consistent central band of elevated prediction scores along the normalized RNA sequence, corresponding to motif-enriched regions. In contrast, the flanking regions display relatively low predicted binding activity. This pattern confirms the model’s ability to generate spatially consistent predictions across large-scale input data. The presence of numerous low-scoring background samples further highlights the model’s capacity to distinguish true binding events from non-binding sequences, indicating strong generalization performance.
Together, the two visualizations in Fig. 8 demonstrate that the proposed model effectively captures spatial binding preferences in real biological data, reinforcing its interpretability and practical utility for downstream applications.