Curated metabolic reconstruction from reference genomes
The curated reconstruction encompassed a non-redundant reference set of 263 Bifidobacterium genomes from cultured isolates, including 19 genomes from Bangladeshi strains sequenced in this study (Supplementary Tables 1 and 2). To refine taxonomic assignments, we first constructed a maximum-likelihood phylogenetic tree based on 487 core genes identified through a pangenome analysis (Supplementary Fig. 1). Additional pairwise average nucleotide identity (ANI) comparisons for 39 genomes allowed us to delineate the infraspecific structure of Bifidobacterium longum and Bifidobacterium catenulatum species (Extended Data Fig. 1 and Supplementary Note 1). Overall, the reference set spanned 19 taxa (Supplementary Table 1).
We leveraged a subsystem-based comparative genomics framework35 to reconstruct carbohydrate utilization pathways and predict associated metabolic phenotypes (Fig. 1a). We first mined 222 publications to identify 433 orthologous groups of carbohydrate utilization genes, whose encoded proteins were either experimentally characterized in bifidobacteria (210 metabolic functional roles), shared substantial sequence similarity with proteins characterized in other microbial taxa (80 roles) or were previously assigned putative functions (143 roles). Genomic context analysis, including in silico transcriptional regulon reconstruction (Supplementary Notes 2 and 3), enabled tentative functional predictions for 156 additional gene groups involved in glycan metabolism. The resulting curated set of 589 roles—comprising 235 components of glycan-specific transporters, 197 catabolic CAZymes, 72 downstream catabolic enzymes and 85 transcription factors—was used to functionally annotate 39,589 of 541,418 protein-coding genes across 263 reference genomes (Supplementary Tables 4 and 8). Manual curation improved 76.6% and 69% of annotations over Prokka and EggNOG-mapper, respectively, including more than 90% of annotations for transporters and transcriptional regulators (Fig. 1b). The metabolic reconstruction also captured 82.2% of catabolic CAZymes identified by dbCAN (Fig. 1c).
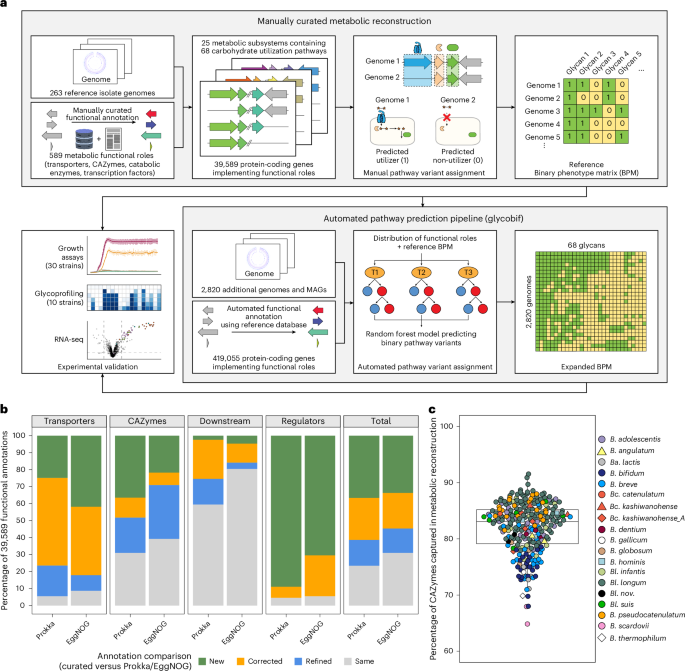
a, An overview of the computational framework. We analysed the distribution of 589 metabolic functional roles (glycan transporters, catabolic enzymes and transcription factors) across 263 reference Bifidobacterium genomes. Manual reconstruction of 68 carbohydrate utilization pathways enabled the assignment of binary pathway variants corresponding to predicted glycan utilization phenotypes based on specific genomic signatures (Extended Data Fig. 2). This curated dataset was used to train an automated pathway prediction pipeline (glycobif), which outputs (1) the distribution of functional roles across additional 2,820 Bifidobacterium genomes and (2) a BPM reflecting the inferred presence or absence of pathways in each genome. Predicted phenotypes for 20 reference and 10 additional strains were compared with in vitro growth profiles to evaluate prediction accuracy. b, A comparison of functional gene annotations obtained via manual curation versus automated tools in the 263 reference Bifidobacterium genomes. Stacked bar plots show the distribution of 39,589 manually curated annotations across four categories: ‘new’, annotations that update non-specific predictions (for example, hypothetical protein); ‘corrected’, annotations that replace specific but incorrect predictions; ‘refined’, annotations that add functional precision (for example, substrate and linkage specificity for GHs); ‘same’, annotations that are essentially identical to automated output (Supplementary Table 13). c, The percentage of catabolic CAZymes (GHs, CEs and polysaccharide lyases) captured in the reconstructed metabolic pathways across the 263 reference Bifidobacterium genomes. Each point represents a genome.
The genome-wide distribution of genes assigned to 589 functional roles was used to reconstruct 68 catabolic pathways: 18 for monosaccharides and their derivatives (sugar alcohols and acids), 39 for di- and oligosaccharides and 11 for polysaccharides (Supplementary Table 5). To link gene conservation patterns with metabolic phenotypes, we first established rules that define genomic signatures distinguishing metabolic pathway variants (Methods, Extended Data Fig. 2 and Supplementary Table 6). Each pathway variant was then converted into a binary phenotype, classifying strains as predicted utilizers (‘1’) or non-utilizers (‘0’) of specific carbohydrates. These assignments formed a binary phenotype matrix (BPM), summarizing the predicted utilization profiles of 263 reference Bifidobacterium strains spanning 68 glycans (Supplementary Table 7). As a preliminary validation of the reconstruction, we compared predicted phenotypes with in vitro growth data for 33 strains from previous studies8,28,36, yielding 94% accuracy (Supplementary Table 17a–d).
Automated pathway prediction across large genomic datasets
We utilized the metabolic reconstruction for 263 reference Bifidobacterium genomes to analyse the representation of glycan utilization pathways in an additional set of 2,820 non-redundant genomes (Supplementary Table 3). This set included 364 isolate genomes and 2,456 high-quality metagenome-assembled genomes (MAGs) with completeness ≥97% and contamination ≤3%. Twelve genomes represented four taxa absent from the reference collection, and nine were from Bangladeshi and Malawian strains isolated in previous studies37,38,39 and sequenced in this work (Supplementary Table 1). We used annotated protein sequences of reference strains to assign functions to a subset of 419,055 protein-coding genes in the 2,820 genomes. These functional annotations, combined with the reference BPM, were used to train a random forest model that predicted the presence of 68 reconstructed carbohydrate utilization pathways (Methods, Fig. 1a and Supplementary Tables 9 and 10).
Interspecies diversity in glycan utilization
The BPMs for 263 reference and 2,820 additional genomes were merged to assess the distribution of glycan utilization pathways across the Bifidobacterium genus. Non-metric multidimensional scaling (NMDS) of the Hamming distance matrix derived from the BPM of 3,083 genomes revealed grouping by species and subspecies, with taxonomy explaining 91% of the variation (permutational multivariate analysis of variance (PERMANOVA) R2 = 0.91, P = 0.001; Fig. 2a). A significant dispersion effect (F = 81.06, P = 0.001) indicated that strain-level variability in pathway representation differed across taxa, probably also influencing the separation.
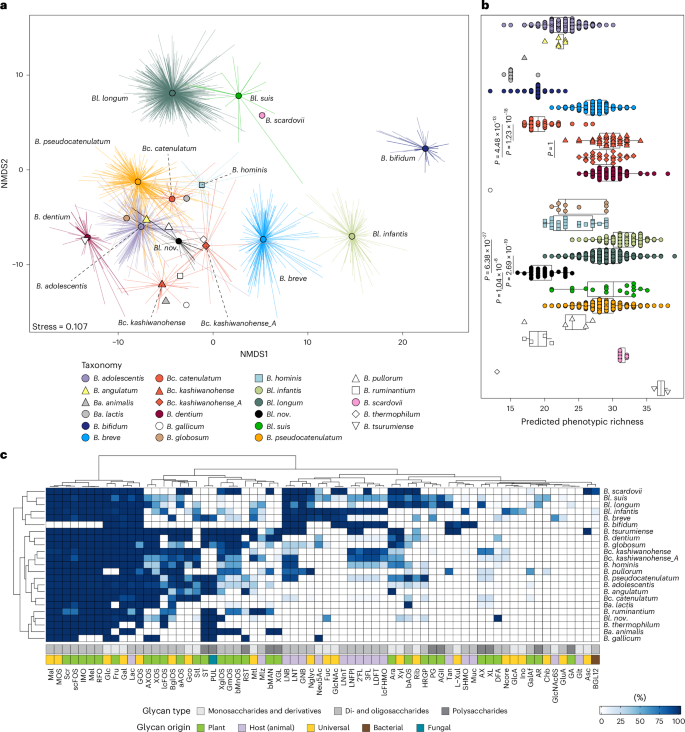
a, NMDS of a Hamming distance matrix derived from the presence–absence patterns of 68 predicted carbohydrate utilization pathways across 627 isolate genomes plus 2,456 MAGs. Points represent genomes; spider lines connect genomes to their group (taxon) centroid. Colours and shapes of centroids indicate taxonomic assignments. b, Predicted phenotypic richness (the total number of carbohydrate utilization pathways) at species and strain levels. Each point represents a genome. Box plots show the median (centre line), interquartile range (IQR; box bounds) and full data range excluding outliers (whiskers, defined as 1.5× IQR). Statistical comparisons were performed using a two-sided GLM with a Poisson distribution, followed by post-hoc pairwise comparisons with Bonferroni correction. The sample size (n) per group corresponds to the number of genomes analysed. c, A heat map of the proportion of genomes within each taxon encoding the 68 predicted carbohydrate utilization pathways. The colour intensity indicates the percentage of genomes that encode each pathway. Annotation rows at the bottom indicate pathway and phenotype classifications. Full names are provided in Supplementary Table 5.
We observed significant differences in predicted phenotypic richness (total number of predicted carbohydrate utilization pathways) between taxa, including phylogenetically close subspecies sharing over 95% ANI (Poisson generalized linear model (GLM), P < 2.2 × 10⁻¹⁶; Fig. 2b). For example, Bifidobacterium catenulatum subsp. catenulatum (Bc. catenulatum) had significantly lower phenotypic richness than subspecies kashiwanohense (Bc. kashiwanohense) and kashiwanohense_A (Bc. kashiwanohense_A) due to the absence of utilization pathways for fucosylated HMOs (for example, 2′-fucosyllactose (2′FL) and 3-fucosyllactose (3FL)) and certain plant oligosaccharides (for example, β-mannose oligosaccharides, bMnOS) in >95% of genomes (Extended Data Fig. 3 and Supplementary Note 4).
Pathways for glucose (Glc), galactose (Gal), fructose (Fru), lactose (Lac) and galactooligosaccharide (GOS) utilization were identified in over 98% of analysed genomes, defining the core catabolic potential of human-colonizing bifidobacteria (Fig. 2c). Pathways for sucrose (Scr), maltose (Mal), maltooligosaccharide (MOS), isomaltooligosaccharide (IMO), melibiose (Mel), raffinose-family oligosaccharide (RFO) and short-chain fructooligosaccharide (scFOS) metabolism were encoded in over 84% of genomes, indicating broad conservation across most species, except Bifidobacterium bifidum. Other pathways showed more sporadic distribution patterns, reflecting species-level adaptations for metabolizing dietary glycans of different origins and structures. For example, B. bifidum exhibited a notable genomic specialization towards the metabolism of host mucin O-glycans, HMOs and their degradation products lacto-N-biose (LNB), galacto-N-biose (GNB) and N-acetyl-d-glucosamine (GlcNAc)—consistent with prior reports40 (Fig. 2c). At the same time, most B. bifidum genomes lacked complete pathways for utilizing plant-derived mono-, di-, oligo- and polysaccharides. Other bifidobacteria, including the specialist HMO utilizer Bl. infantis, were more versatile in their predicted glycan utilization profiles, although complete pathways for plant polysaccharide degradation were less common than those for catabolizing the corresponding mono- and oligosaccharide components (Fig. 2c).
Hierarchical clustering of the BPM for 263 reference genomes showed a moderate correlation with core-gene phylogeny (cophenetic correlation 0.58, permutation test, P < 0.001; Supplementary Fig. 2), indicating incomplete concordance between predicted glycan utilization capabilities and phylogenetic relatedness. For example, the predicted phenotypic profiles of Bl. infantis and Bl. longum, two phylogenetically related subspecies within the B. longum species, were markedly different. The representation of glycan utilization pathways in Bl. infantis more closely resembled that of B. breve—a more distantly related species inhabiting the neonatal human gut. Given the importance of B. longum in infant microbiota development, we next conducted a more focused analysis of pathway variability within this heterogeneous species.
Diversity of glycan metabolism within the B. longum species
The B. longum species comprises multiple subspecies distinguished by phylogeny and specific phenotypic traits26,41,42,43. Our phylogenomic and ANI analyses clustered B. longum genomes into three clades matching previously described subspecies—infantis (Bl. infantis), longum (Bl. longum) and suis (Bl. suis)—and a distinct clade hereafter referred to as Bl. nov. (Extended Data Fig. 1a, Supplementary Fig. 1 and Supplementary Note 1). Bl. nov. exhibited significantly lower predicted phenotypic richness than other subspecies (Fig. 2b), lacking pathways for LNB, GNB, N-glycan, HMO and T-antigen (Tan) metabolism (Fig. 2c and Supplementary Note 5). Conversely, only Bl. nov. genomes encoded extracellular amylopullulanase ApuB (GH13_14_32), a bifunctional glycoside hydrolase (GH) cleaving both α-1,4 and α-1,6-glycosidic bonds in soluble starch (ST) and pullulan (PUL)44, and a pathway for difructose dianhydride (DFA) metabolism45. These findings suggest that Bl. nov. has a reduced capacity to metabolize host-derived glycans but can degrade α-glucans of plant and fungal origin.
Comparative analysis revealed stark differences in the repertoire of carbohydrate utilization pathways between Bl. infantis and Bl. longum (Fig. 2c). Consistent with previous studies, Bl. infantis genomes were distinguished by the presence of H146 and FL1/2 (ref. 4) gene clusters, which enable the utilization of lacto-N-neotetraose (LNnT), 2′FL, 3FL, lactodifucotetraose (LDFT), lacto-N-fucopentaose I (LNFP I) and sialylated HMOs (SHMOs; Supplementary Tables 7–10). Predicted HMO utilization potential of Bl. longum was more limited: 35% of genomes encoded extracellular lacto-N-biosidase LnbX (GH136) that cleaves lacto-N-tetraose (LNT) and LNFP I47, and only 2.3% carried a gene cluster driving intracellular utilization of 2′FL, 3FL, LDFT and LNFP I48,49. Beyond HMO metabolism, Bl. infantis exclusively encoded catabolic pathways for glucuronate (GlcA), inositol (Ino) and gluconate (Gco) in 63%, 48% and 23% of genomes, respectively (Extended Data Fig. 4a,b,d,e and Supplementary Note 3). Bl. longum genomes, by contrast, commonly encoded pathways for l-arabinose (Ara), α/β-arabinooligosaccharides (aAOS/bAOS), type II arabinogalactan (AGII), arabinan (AR), arabinoxylan (AX) and host- or plant-derived O-glycans (Tan and HRGP; Fig. 2c). These findings illustrate an ecological divergence between Bl. infantis and Bl. longum shaped by their respective adaptations to thrive on milk glycans during breastfeeding versus plant-derived carbohydrates after weaning.
Predicted glycan utilization profiles within the Bl. suis group were highly heterogeneous. Most genomes encoded a set of metabolic pathways similar to that of Bl. longum but more frequently included pathways for the utilization of N-acetylneuraminic acid (Neu5Ac; 44% versus 2%), l-fucose (Fuc; 61% versus 1.7%) and fucosylated HMOs (2′FL, 3FL, LDFT and LNFP I; 56% versus 2.3%), while lacking genes encoding extracellular α-l-arabinofuranosidases required for AX degradation50,51 (Fig. 2c and Supplementary Tables 8 and 10). By contrast, the Bangladeshi isolate Bg131.S11_17.F6 shared multiple genomic features with Bl. infantis, including the presence of the H1 gene cluster and the absence of araBDA genes (Supplementary Table 8). Consequently, this strain was predicted to metabolize more HMO structures (for example, LNnT and SHMOs) than other Bangladeshi Bl. suis strains, while lacking the capacity to utilize arabinose-containing glycans of plant origin (for example, Ara, aAOS and AGII; Supplementary Fig. 3). Genomic analysis of ten additional animal-derived Bl. suis strains confirmed the uniqueness of the Bg131.S11_17.F6 isolate and further underscored the phenotypic heterogeneity within this group (Extended Data Fig. 5 and Supplementary Note 5). Collectively, these findings reveal pronounced differences in carbohydrate utilization across B. longum subspecies and underscore pervasive strain-level heterogeneity within each clade.
Strain-level heterogeneity of glycan metabolism
Beyond interspecies differences, we observed extensive strain-level variability in predicted carbohydrate utilization capabilities. Among the 68 reconstructed pathways, 66 exhibited variability within at least one taxonomic group (Fig. 2c and Supplementary Tables 7 and 9). The genomic differences driving this heterogeneity ranged from individual genes encoding extracellular GHs enabling polysaccharide degradation to multigene clusters comprising up to 20 genes encoding complete metabolic pathways (Supplementary Table 8). By contrast, biosynthetic pathways for essential metabolites, such as amino acids and B vitamins, were largely conserved. A few exceptions included riboflavin (B2) biosynthesis, which varied across Bl. suis and Bc. kashiwanohense_A, and thiamine (B1) and niacin (B3) biosynthesis in Bifidobacterium adolescentis (Extended Data Fig. 6 and Supplementary Table 11).
The observed heterogeneity reflects that, while most Bifidobacterium taxa follow general ecological strategies centred on the utilization of specific core glycans, individual strains can exhibit substantial metabolic tuning. For instance, Bl. infantis Bg064.S07_13.C6 harboured pathways for xylooligosaccharide (XOS) and long-chain fructooligosaccharide (lcFOS) utilization, suggesting an enhanced capacity to metabolize dietary plant glycans compared with most other Bl. infantis strains (Supplementary Fig. 3). Conversely, several B. adolescentis isolates carried pathways for the utilization of LNB, GNB, N-glycans (strains AF96-10M2bTA and UN03-88) and fucosylated HMOs (strain M56B_1C3), highlighting the presence of traits characteristic of infant-adapted taxa in a species commonly associated with the adult gut (Supplementary Tables 9 and 10). Additional examples of notable strain-specific variability of genomic features related to carbohydrate utilization were found in Bangladeshi isolates and are detailed below.
Unique glycan utilization features of Bangladeshi strains
Our previous study described distinctive genomic features of Bangladeshi Bl. infantis strains related to N-glycan and β-glucoside catabolism23. Here, we identified a distinct gene cluster (xgl) in Bc. kashiwanohense Bg42221_1E1 and Bc. kashiwanohense_A Bg42221_1D3, two isolates from a Bangladeshi infant (Fig. 3a). This cluster encoded multiple GHs (families 3, 5_4, 29, 31, 42 and 43_12), an unclassified carbohydrate esterase (CE), a β-glucoside kinase and an ABC transport system, which together may catabolize plant hemicelluloses such as xyloglucans (XGLs). The reconstructed XGL pathway involved the hydrolysis of the XGL backbone to oligosaccharides by extracellular endo-β-1,4-glucanase Xgl5A (GH5_4), which shares catalytic and glycan-binding residues with xyloglucanase PpXG5 from Paenibacillus pabuli XG552 (Extended Data Fig. 7a). Released oligosaccharides would be imported into the cell and degraded sequentially to individual monosaccharides and cellobiose by the coordinated action of GHs and CEs via a mechanism similar to that described for Ruminiclostridium cellulolyticum53 (Fig. 3b). Regulon reconstruction of XglT, a putative TetR-family transcription factor, suggested potential co-regulation of the xgl cluster and cbpA, which encodes a GH94-family cellobiose phosphorylase (Fig. 3a–c and Supplementary Table 19). The xgl cluster was identified in only 3 of 110 studied B. catenulatum genomes but was conserved in Bifidobacterium dentium and Bifidobacterium tsurumirense (Fig. 2c).
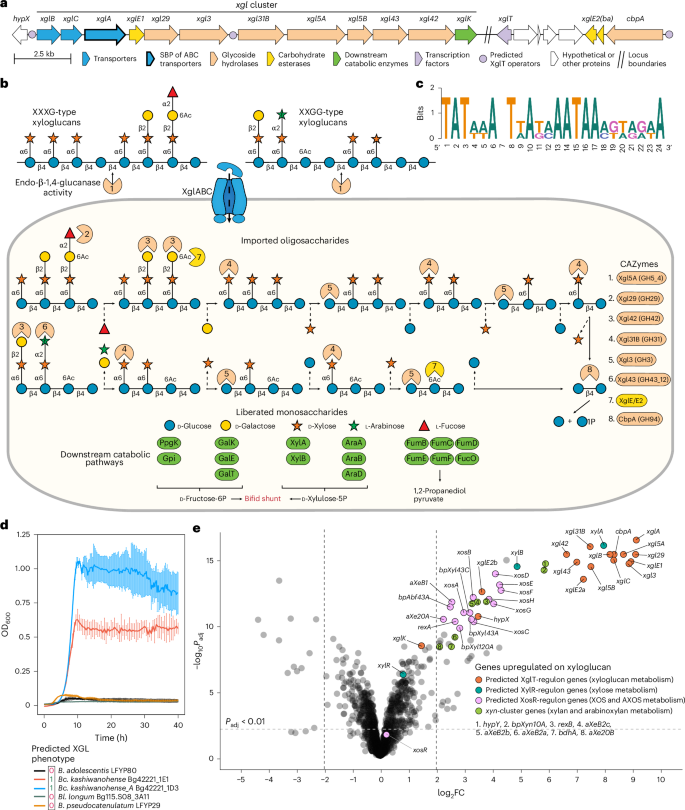
a, Gene clusters potentially driving XGL degradation in Bc. kashiwanohense Bg42221_1E1. b, Reconstructed XGL degradation pathway in Bc. kashiwanohense Bg42221_1E1: (1) XGL chains are potentially cleaved by extracellular endo-β-1,4-glucanase Xgl5A, and (2) released oligosaccharides are imported and metabolized inside the cell by a coordinated action of GHs, CEs and downstream catabolic enzymes. c, The predicted DNA-binding motif of the XglT transcriptional regulator potentially controlling XGL metabolism genes. d, Growth curves of Bifidobacterium strains in MRS-AC supplemented with 0.5% tamarind XGL. Data represent the mean ± s.d. of three biological replicates. e, A volcano plot showing differential gene expression (log2 fold change (FC) versus −log10-adjusted P value) in Bc. kashiwanohense Bg42221_1E1 grown in MRS-AC with tamarind XGL versus MRS-AC with Lac. Differential expression was assessed using moderated two-sided t-tests with empirical Bayes variance moderation. P values were adjusted for multiple comparisons using the Benjamini–Hochberg procedure. Genes were considered differentially expressed at Padj < 0.01 and |log2FC| > 2. Genes belonging to the reconstructed XglT, XylR and XosR regulons, as well as xyn cluster genes, are highlighted. Exact log2FC values, test statistics and adjusted P values are provided in Supplementary Table 21a.
Another gene cluster, unique to Bc. kashiwanohense Bg42221_1E1, contained orthologues of H1 cluster HMO utilization genes from Bl. infantis and the ‘outlier’ Bangladeshi Bl. suis Bg131.S11_17.F6 strain (Fig. 4a). The H1 variant identified in Bg42221_1E1 encoded two ABC transporters, one of which (HmoABC) is probably involved in the uptake of LNnT and other type II HMO structures54. In addition, this cluster encoded orthologues of characterized β-N-acetylglucosaminidase (GH20), two α-fucosidases (GH29 and GH95) and α-sialidase (GH33), which mediate intracellular HMO hydrolysis55,56,57, along with downstream catabolic pathways for GlcNAc and Fuc. Regulon reconstruction suggested the potential transcriptional control of H1 cluster genes in Bc. kashiwanohense Bg42221_1E1 by NagR, a GlcNAc-responsive ROK-family repressor58 (Fig. 4a and Supplementary Table 19).
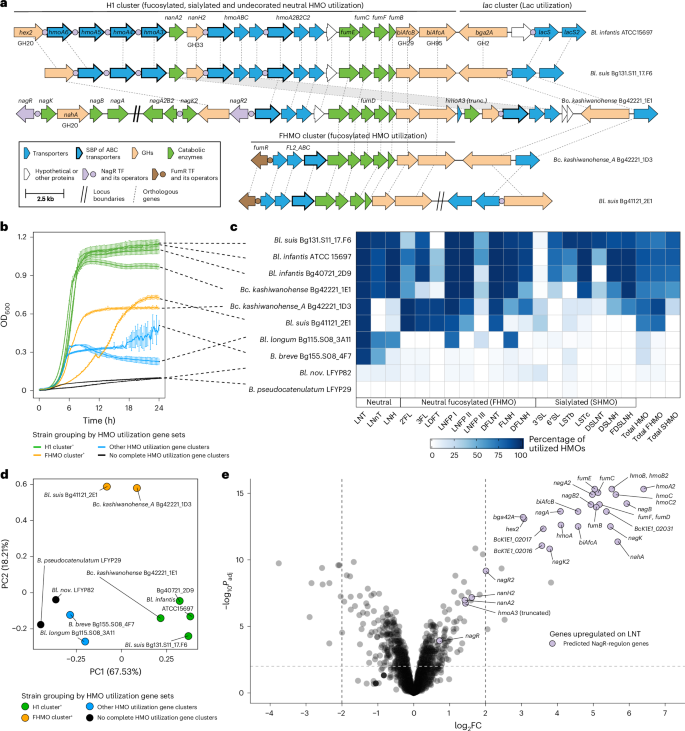
a, A schematic representation of HMO utilization genes in selected Bangladeshi Bifidobacterium strains and their homology to H1 cluster genes from Bl. infantis ATCC 15697. The H1 cluster encodes multiple paralogous substrate-binding proteins (SBPs) of putative HMO transporters (Hmo), whereas FHMO encodes a characterized, non-orthologous transporter (FL2_ABC) specific for fucosylated HMOs. b, Growth curves of Bifidobacterium strains in MRS-AC supplemented with pooled HMOs. Data represent the mean ± s.d. of three biological replicates. Curves are colour-coded based on the presence of specific HMO utilization gene clusters in the respective strains. c, HPLC-based quantification of HMO depletion from culture supernatants after 24 h. Data represent the percentage of utilized HMOs (mean of three biological replicates) relative to the medium control. Total HMO, total HMO utilized; total FHMO, total fucosylated HMO utilized; total SHMO, total sialylated HMO utilized. Concentrations of individual HMOs (nmol ml−1) are provided in Supplementary Table 18b. d, PCA of combined growth metrics (maximum OD600, area under the curve and maximum growth rate) and per cent utilization of individual HMOs. Each point represents a strain, colour-coded by the presence of specific HMO utilization gene clusters. Axes represent principal components (PCs). In b and d, the notations H1 cluster+ and FHMO cluster+ indicate that a strain carries the complete H1 or FHMO gene cluster, respectively. e, A volcano plot showing differential gene expression (log2FC versus −log10-adjusted P value) in Bc. kashiwanohense Bg42221_1E1 grown in MRS-AC with LNT versus MRS-AC with Lac. Differential expression was assessed using moderated two-sided t-tests with empirical Bayes variance moderation. P values were adjusted for multiple comparisons using the Benjamini–Hochberg procedure. Genes were considered differentially expressed at Padj < 0.01 and |log2FC| > 2. Genes belonging to the reconstructed NagR regulon are highlighted. Exact log2FC values, test statistics and adjusted P values are provided in Supplementary Table 21b.
Other notable features of Bangladeshi Bifidobacterium isolates included a putative d-galactonate utilization pathway found exclusively in B. breve Bg41721_1C11 (Extended Data Fig. 4d,e and Supplementary Note 3). This strain, along with B. breve Bg131.S11_D6, also lacked the nan gene cluster, which encodes a well-characterized Neu5Ac catabolic pathway59 (Extended Data Fig. 4f,g). This absence of the nan cluster in these two strains was unexpected, given its previously reported broad conservation in B. breve genomes29,59 and its established role in utilizing Neu5Ac via cross-feeding on SHMOs and mucin O-glycans degraded by B. bifidum59,60.
These results demonstrate that Bangladeshi Bifidobacterium strains carry unique adaptations for metabolizing dietary plant polysaccharides and HMO, while lacking pathways conserved in well-characterized strains. These traits may reflect strain-level adaptation to the diet and lifestyle of Bangladeshi children. We next investigated whether broader patterns of bifidobacterial carbohydrate utilization are associated with host age and lifestyle across diverse human populations.
Associations between pathway profiles and lifestyle
We examined the enrichment of glycan utilization pathways in Bifidobacterium genomes from different populations based on: (1) host age and stage of gut microbiota maturation (<3 years: infant or transitional; ≥3 years: adult-like), and (2) host lifestyle (‘Westernized’ versus ‘non-Westernized’ as defined by Pasolli et al.61). Host glycan (for example, HMO) utilization pathways were enriched in genomes from the ‘age <3’ group, whereas plant glycan utilization pathways were more prevalent in adult-associated (≥3 years) genomes across both lifestyle groups (Fisher’s exact test, Benjamini–Hochberg adjusted P ≤ 0.01; Extended Data Fig. 8a,b). Within the ‘age <3’ group, 14 pathways (11 for plant glycans) were enriched in the Westernized group and 24, including 11 for HMOs and their constituent blocks LNB, Neu5Ac and Fuc, in the non-Westernized group (Extended Data Fig. 8c). These differences probably stem from the uneven distribution of taxa across Westernized and non-Westernized microbiotas. For example, pathways enriched in the non-Westernized group were associated with Bl. infantis, a taxon more prevalent in that group (odds ratio 4.98, 95% confidence interval 3.24–7.51, Fisher’s exact test, P = 1.82 × 10⁻¹¹).
Within taxa, pathways for sorbitol (Stl), mannitol (Mtl), lcFOS and pectic galactan (PG) metabolism were enriched in Westernized Bl. infantis genomes (Extended Data Fig. 8d). The Stl and lcFOS catabolic pathways were also more prevalent in Westernized B. adolescentis genomes, and the PG pathway was overrepresented in Westernized Bl. longum genomes. Conversely, non-Westernized B. breve genomes were enriched for melezitose (Mlz) and 1,2-β-oligoglucan (BGL12) utilization pathways but more frequently lacked the Neu5Ac pathway. These findings underscore how lifestyle-driven ecological pressures shape glycan utilization strategies among bifidobacteria. We next tested carbohydrate utilization phenotypes in representative isolates to validate predictions from the reconstruction framework.
Growth-based validation of predicted glycan utilization
To experimentally validate in silico phenotypic predictions, we conducted in vitro growth assays on 30 geographically diverse Bifidobacterium strains (15 Bangladeshi, 8 Malawian, 5 US and two European). Growth was tested on 43 substrates corresponding to 38 predicted glycan utilization phenotypes: 13 monosaccharides and derivatives, 18 di- or oligosaccharides and 7 polysaccharides (Fig. 5a). Strains were cultured in a sugar-free De Man–Rogosa–Sharpe (MRS-AC) medium4,58 supplemented with the test substrate (5–10 mg ml−1), and growth was defined using strain-specific optical density at 600 nm (OD600) thresholds (Methods and Supplementary Fig. 4). Growth outcomes were compared with predictions derived from manual curation (20 strains) or the automated pipeline (10 strains; Fig. 5b).
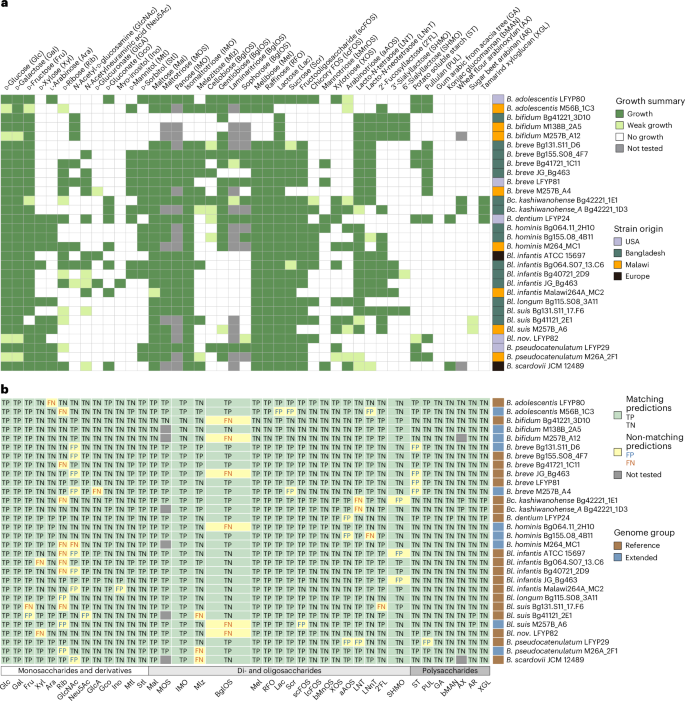
a, A summary of in vitro growth profiles of 30 Bifidobacterium strains on 43 substrates. Growth, weak growth and no growth were categorized on the basis of strain-specific OD600 thresholds (Methods). The annotation column on the right shows the geographical origin of each strain. The details about substrates are given in Supplementary Table 15; all growth curves are shown in Supplementary Fig. 4; raw OD600 data are provided in Supplementary Table 16. b, A comparison of 38 predicted carbohydrate utilization phenotypes with corresponding in vitro growth profiles for the same 30 strains. Predicted phenotypes were tested using a singular substrate, except IMO (panose and isomaltotriose), BglOS (cellobiose, gentiobiose, laminaritriose and sophorose) and SHMO (3′SL and 6′SL). Prediction outcomes are colour-coded to indicate agreement between predicted and observed phenotypes. The annotation column on the right shows whether genomes belong to the reference or extended dataset. The annotation row at the bottom represents phenotype classification (glycan type). Summary data are provided in Supplementary Table 17f; full names of abbreviations are provided in Supplementary Table 5.
Prediction accuracy was similar for manual and automated approaches: 95% and 94%, respectively, with Matthews correlation coefficients of 0.9 and 0.89 (Supplementary Table 17e,f). False-negative predictions (growth despite predicted non-utilization) probably stemmed from incomplete knowledge about monosaccharide and HMO transporters. For example, Bl. suis Bg131.S11_17.F6 grew on 2′FL despite lacking genes encoding known transporters for this substrate4,5 (Supplementary Table 8). Some false-positive predictions (predicted utilization but no growth) may have resulted from gene disruptions, such as a premature stop codon in the gltA gene in B. pseudocatenulatum LFYP29, which probably impaired the LNT transport function.
As predicted, Bl. nov. LFYP82 was the only B. longum strain to grow on ST and PUL (Fig. 5a). We also validated strain-specific utilization of scFOS, lcFOS, XOS and GlcA in Bl. infantis (Fig. 5 and Extended Data Fig. 4c). Similarly, while two B. breve strains grew on mannotriose (bMnOS), none grew on konjac glucomannan (bMAN), in contrast to B. dentium LFYP24 and Bifidobacterium scardovii JCM 12489, which harboured extracellular endo-β-1,4-mannanases (Extended Data Fig. 7e–g and Supplementary Note 2).
We further validated several unusual glycan utilization traits predicted in Bangladeshi and Malawian isolates. Bc. kashiwanohense Bg42221_1E1 and Bc. kashiwanohense_A Bg42221_1D3, both carrying the xgl cluster, grew in the medium supplemented with tamarind XGL (Fig. 3d). Bangladeshi B. breve isolates lacking the Neu5Ac catabolic pathway (Bg41721_1C11 and Bg131.S11_D6) failed to grow on Neu5Ac, unlike other tested B. breve strains (Extended Data Fig. 4h). Finally, consistent with our prediction, B. adolescentis M56B_1C3 grew on 2′FL, highlighting the previously unrecognized capacity of this species (Fig. 5).
Glycoprofiling of HMO utilization
The H1 cluster in Bl. infantis is believed to enable the metabolism of multiple HMOs46, although the precise range of structures cannot be confidently predicted due to limited understanding of the functions of individual transporter genes. Given the presence of homologous H1 clusters in Bl. suis Bg131.S11_17.F6 and Bc. kashiwanohense Bg42221_1E1, we compared their HMO utilization with that of (1) two Bl. infantis strains, (2) phylogenetically related strains carrying a fucosylated HMO utilization gene cluster (FHMO) instead of H1 (Bl. suis Bg41121_2E1 and Bc. kashiwanohense_A Bg42221_1D3; Fig. 4a), and (3) distantly related strains predicted to have weak (Bl. longum and B. breve) or minimal (Bl. nov. and B. pseudocatenulatum) HMO utilization capacity.
Strains with the H1 cluster reached the highest optical densities when grown in MRS-AC supplemented with an HMO mixture isolated from pooled human milk (Fig. 4b). High-performance liquid chromatography (HPLC)-based glycoprofiling of culture supernatants revealed that these strains consumed 72–86% of total HMOs by 24 h, including multiple fucosylated and sialylated structures (Fig. 4c and Extended Data Fig. 9). However, Bl. suis Bg131.S11_17.F6 and Bc. kashiwanohense Bg42221_1E1 did not efficiently utilize 2′FL, the most abundant HMO species in the mixture, in line with the absence of characterized 2′FL transporters. By contrast, strains carrying the FHMO cluster preferentially metabolized fucosylated HMOs, completely depleting 2′FL while exhibiting limited utilization of sialylated structures. Among strains negative for both H1 and FHMO clusters, Bl. longum Bg115.S08_3A11 depleted LNT, LNnT, LNFP I, LNFP III and lacto-N-hexaose (LNH), probably via partial extracellular degradation by β-galactosidase and lacto-N-biosidase, whereas B. breve Bg155.S08_4F7 metabolized LNT and LNnT intracellularly (Supplementary Fig. 5). Bl. nov. LFYP82 failed to efficiently utilize any tested HMOs, consistent with lineage-specific loss of relevant genes and pathways. Principal component analysis (PCA) of growth and HMO utilization data separated strains with H1 and FHMO clusters from each other and all others (Fig. 4d). These findings provide the experimental evidence that Bc. kashiwanohense and Bl. suis strains carrying the H1 cluster exhibit HMO utilization patterns comparable to Bl. infantis, and highlight how variation in gene repertoires drives metabolic divergence among closely related Bifidobacterium strains.
Transcriptional profiles of glycan utilization in Bc. kashiwanohense
We used RNA sequencing (RNA-seq) to test regulon predictions and pathway assignments in Bc. kashiwanohense Bg42221_1E1, which harbours both xgl and H1 gene clusters. Transcriptomic comparison of cultures grown in MRS-AC-XGL versus MRS-AC-Lac revealed strong induction (100–550 fold) of most xgl genes and cbpA, supporting their co-regulation by XglT and a shared role in XGL metabolism (Fig. 3a,e and Supplementary Table 21a). Genes involved in xylose, (arabino)xylooligosaccharide and (arabino)xylan metabolism showed moderate upregulation (4–30 fold), probably in response to intracellular xylose release, which may serve as a transcriptional effector of predicted transcriptional repressors XylR (ROK family) and XosR62 (LacI family; Extended Data Fig. 7b,c, Supplementary Table 19 and Supplementary Note 2). Next, we compared the transcriptomes of Bc. kashiwanohense Bg42221_1E1 grown in MRS-AC-LNT and MRS-AC-Lac. All H1 cluster genes except nanA2 and nanH2 were significantly upregulated in the presence of LNT (Fig. 4e and Supplementary Table 21b), consistent with the proposed regulation by NagR, a GlcNAc-responsive repressor implicated in the control of HMO utilization in bifidobacteria58. Overall, the observed transcriptomes suggest that the regulatory networks of this strain are adapted for foraging on mixtures of HMOs and plant oligo- and polysaccharides.
Our large-scale genomic and experimental analyses pinpoint ecological differences between glycan foraging strategies within Bifidobacterium that reflect species-level evolutionary adaptation to different habitats (for example, infant gut versus adult gut) and dietary carbohydrate composition. The results also underscore considerable strain-level variability, probably shaped by host lifestyle and local dietary exposures.